🎮 YBA Pity Calculator
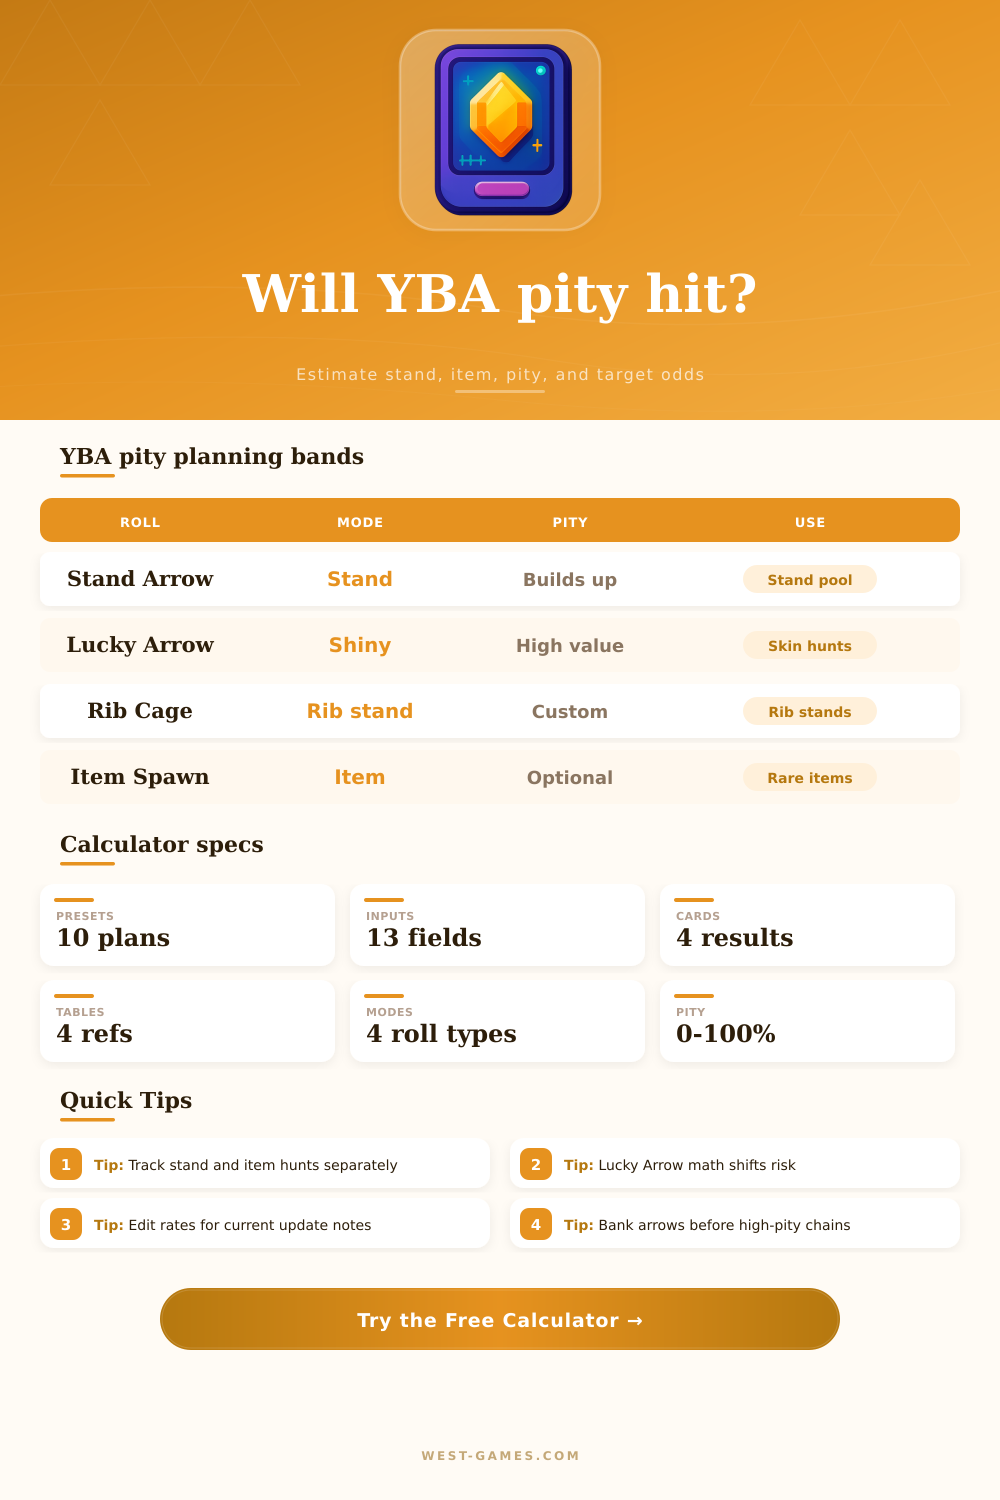
Plan Roblox Your Bizarre Adventure stand arrows, Lucky Arrows, Rib Cages, item spawns, current pity percent, target rarity, expected rolls, cumulative chance, and resource gaps.
| Preset | Base | Pity gain | Planning note |
|---|---|---|---|
| Stand Arrow rare | 0.80% | 0.04% | Editable stand/skin chain |
| Lucky Arrow shiny | 1.25% | 0.00% | Large luck multiplier |
| Rib Cage rare | 2.50% | 0.02% | Smaller target pool |
| Item spawn rare | 0.50% | 0.00% | Pickup/check model |
| Corpse part | 0.70% | 0.00% | Server and route dependent |
Every rate is editable because YBA updates, event boosts, and community servers may use different assumptions.
| Input | Meaning | Formula use | Warning |
|---|---|---|---|
| Current pity | Starting bonus | Added to base | Cap still applies |
| Pity gain | Fail-chain growth | Added after misses | Use 0 if none |
| Pity cap | Max bonus | Limits pity portion | Not hard pity |
| Pool share | Exact target split | Multiplies hit chance | Set 100 if exact |
| Luck multiplier | Boosted mode | Final multiplier | Caps at 100% |
The calculator compounds each roll with rising pity, so planned roll count matters more than a single displayed rate.
| Per-roll chance | 50% odds | 90% odds | How to read |
|---|---|---|---|
| 0.10% | 693 | 2302 | Very long hunt |
| 0.50% | 139 | 460 | Rare item style |
| 1.00% | 69 | 230 | Common skin plan |
| 2.50% | 28 | 91 | Small pool target |
| 5.00% | 14 | 45 | Boosted chain |
These checkpoints ignore pity growth; your result cards use the editable pity model above.
| Goal | Best input focus | Useful card | Stop rule |
|---|---|---|---|
| Specific stand | Pool share | Expected rolls | Storage full |
| Skin hunt | Pity percent | Ending pity | After target hit |
| Lucky Arrow | Owned rolls | Roll gap | Before wasting supply |
| Item route | Roll count | Cumulative chance | Route time cap |
| Trade stock | Desired hits | Expected rolls | Value target met |
For long farms, update the current pity after each session and rerun the plan before spending scarce arrows.
In Your Bizarre Adventure, there’s an instance that puts you in a certain position: with one arrow left to roll, yet it doesn’t seem like you can get to it. It give you anxiety, because your distance from fulfillment is measured in percentages and waiting time. But with the calculator (above), that math happens for you, so you don’t waste resources guessing. You know your chances, and they’re based on real likelihoods, not wishful thinking. And those odds factor in roll multipliers and pity mechanics.
The way this works… And I emphasize “this” because there are many factors… Is that pity isn’t just a safety net: it’s a factor which change your chance of success with each failure. By entering the value of your existing pity % into the tool, you’re accepting that your past failure makes succeeding more likely next time. That means most players treats each roll like an isolated incident; however, they fail to account for weight of their history. So the tool does: It adds the pity bonus (up to its cap) to the base rate.
Use Data to Make Better Choices
And this cap is what you set based off the current meta. Is it a soft one, where the curve tapers off? Or a hard one, with a 10% lock? This can be all or nothing. It depends which preset you choose. If you’re hunting a Lucky Arrow, which has low supply and high variance, it’s different than a normal stand arrow, which uses the same slow build across many tries. Hunting for a shiny skin relies more heavy on luck boosts; the way the tool operate shifts here. Pick the right preset based on your inventory. Using a stand arrow model for a Lucky Arrow hunt is misguided: the probability distribution are entirely different, leading to false confidence.
People are surprised by pool share as an input, but it’s the portion of rarity that is yours to target. Five percent? Well then if I’m going after one legendary out of 20, my pool share is five percent. Which means even if the game promises me a legendary, it’s going to be a long shot before it’s the right one. Splitting probability dilutes your effective chance (see the reference table). If you don’t account for your pool share, you will vastly overestimate your chances of success, which makes it impossible to plan realisticly.
Finally, the output cards don’t take your time investment into account, so you also must decide when to stop rolling. Translate abstract numbers into actual gameplay hours with the minutes per roll field. Three-hundred more attempts might mean six hours of grinding if each attempt take two minutes. That’s a tangible cost, and you’ll weigh the value of the stand against spending those hours doing something else.
To help bridge this gap, the tool shows you how many items you have vs. It shows what the math says you need for a safe margin. Another layer is personal preference. Depending on how aggressive you want to plan, you either accept a lower confidence interval. This means you’re willing to take bigger swings with fewer resources. Or, you can pad the numbers by hoarding more arrows than the average case. This gives yourself a ninety percent probability of success, which is safe planning. That’s not right or wrong; just different tolerances for bad luck. There is no judgment against your spending habits, only the statistical reality of each approach.
So how do we predict it? We don’t. It’s about managing our expectations more then predicting the future. No tool promises a drop in any given system. Instead, you treat that arrow stock like a limited resource, not an unlimited one. When to pull? When to save? This is a matter of making smarter decisions. You should of invest with data instead of gambling on vibes. Aim for the average, but prepare for the worst case. That’s often what makes the difference between satisfying success and frustrating failure. Bank those arrows till the numbers align in your favor.