🖥 Teraflops Calculator
Calculate theoretical and practical GPU compute from shader cores, clock speed, boost behavior, FP32 or FP16 math mode, operations per cycle, workload efficiency, and console or GPU presets.
Relative to PlayStation 5 raw FP32 compute.
Relative to RTX 3060-class FP32 compute.
Relative to RTX 4070 Super raw FP32 compute.
Relative to RTX 4090 raw FP32 compute.
| Unit | Operations per second | In TFLOPS |
|---|---|---|
| GFLOPS | 1 billion | 0.001 |
| TFLOPS | 1 trillion | 1 |
| PFLOPS | 1 quadrillion | 1000 |
| 1 TFLOP | 1,000 GFLOPS | 1 |
Marketing GPU compute is usually peak theoretical FP32 unless stated otherwise.
| Mode | Typical multiplier | Common use |
|---|---|---|
| FP32 | 1.0x | Games, graphics shaders, general compute |
| FP16 packed | 2.0x | AI effects, image processing, mobile/console optimizations |
| FP16 same-rate | 1.0x | Hardware without packed half-rate uplift |
| Tensor/Matrix | Custom | AI math units, not directly comparable to shader TFLOPS |
FP16 numbers should not be compared directly with FP32 game performance.
| Device | Cores / CUs | Clock | FP32 TFLOPS |
|---|---|---|---|
| Steam Deck GPU | 512 shaders / 8 CUs | 1600 MHz | 1.64 |
| Xbox Series S | 1280 shaders / 20 CUs | 1565 MHz | 4.01 |
| PlayStation 5 | 2304 shaders / 36 CUs | 2233 MHz | 10.28 |
| Xbox Series X | 3328 shaders / 52 CUs | 1825 MHz | 12.15 |
| GPU | Cores | Clock used | FP32 TFLOPS |
|---|---|---|---|
| Radeon RX 6600 | 1792 | 2491 MHz | 8.93 |
| GeForce RTX 3060 | 3584 | 1777 MHz | 12.74 |
| Radeon RX 7800 XT | 3840 | 2430 MHz | 18.66 |
| GeForce RTX 4070 Super | 7168 | 2475 MHz | 35.48 |
| Radeon RX 7900 XTX | 6144 | 2499 MHz | 30.71 or 61.42 dual-issue |
| GeForce RTX 4090 | 16384 | 2520 MHz | 82.58 |
AMD RDNA 3 can quote higher FP32 with dual-issue conditions; real game scaling varies.
| Factor | Why it matters | What to compare next |
|---|---|---|
| Memory bandwidth | Shaders can idle if textures, buffers, or frame data arrive too slowly. | GB/s, cache size, bus width, VRAM speed |
| Architecture | Different GPUs do more or less work per FLOP in real engines. | Benchmarks from the same game and settings |
| Clock behavior | Thermals and power limits decide whether boost is sustained. | Telemetry clock, power draw, fan and temperature logs |
| Specialized units | Ray tracing, tensor, AI, video, and geometry blocks are not captured by shader TFLOPS. | RT cores, tensor throughput, media engines, mesh shader support |
Your frame rate counter probably won’t match what’s stamped on box. We’ve all been trained to look at teraflops like they’re some sort of direct indicator of graphical quality, but the truth is a lot messier then you could sum up in a single headline figure. A raw compute metric indicate how many floating point operations a processor can tries to do per second. It doesn’t tell you anything about its ability to render a scene with complex texture loading and lighting, which are the silent killer of theoretical performance.
This calculator will help close the gap by allowing you to dial in clock behavior and efficiency. Clock speed and shader cores is what it starts with. Take those two numbers, multiply them together, add in the operations per cycle and you have the theoretical maximum in terms of what card can do…in theory. That’s a limit found primarily on marketing teams’ spreadsheets.
Why Teraflops Do Not Show True Gaming Speed
The reality is the GPU doesn’t spend a lot of time at peak boost in any game due to power limits engaging as well as thermals kicking in, so the clock drops off. That is why choosing an effective clock instead of simply a boost clock is so important. Use an average or a measured sustained clock and now you has something closer to reality of what will occur over the course of a half hour or more of gaming.
The next thing that gets confusing is precision question. For graphics workloads, the standard is single precision floating point arithmetic (FP32 math). It can handles the complex calculations required for things like geometry, lighting and physics with high accuracy. You may be able to turn the tool into tensor mode, or FP16, and find that the TFLOPS number doubles or triples. But that doesn’t necessarily translate in running your game twice as fast.
The lower precision modes is intended for image processing, or other artificial intelligence type tasks where small amounts of numerical error are tolerable. They’re really only effective when a workload has been specifically tuned to use half precision math. That’s why the page lays it all out in a reference table, illustrating what types of real world uses correspond to each precision mode.
The last and greatest factor is efficiency. In no game does any GPU reaches full utilization. Some games are memory bound, their shaders aren’t crunching numbers because they’re waiting on data from VRAM. Other games simply have poor engine efficiency or suffer from driver overhead. An efficiency percentage of roughly 70 to 80 percent takes those real world bottlenecks into account. It makes that shiny theoretical number a practical one.
It’s also this adjustment that helps explain how two similarly specced GPUs with the same TFLOPS score can do drastically different things in the same game. Perhaps it has greater memory bandwidth, or perhaps it has better cache architecture; whatever it is, it allow the cores to stay fed with data more consistantly.
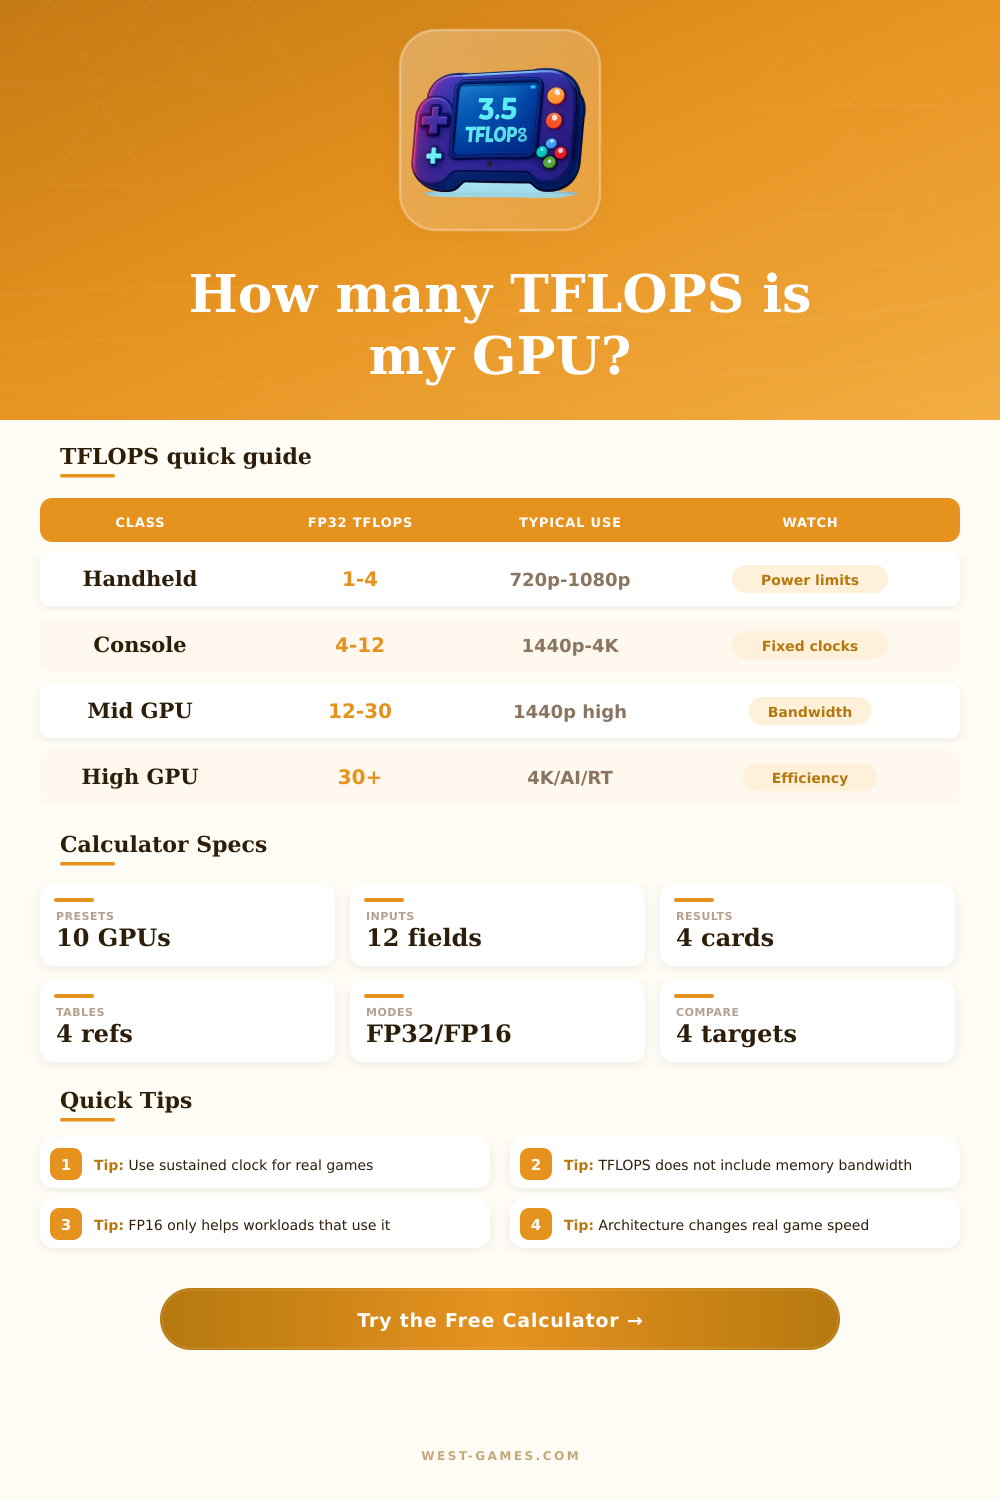
That said, how do you know what to compare your number against? To another card? To a console? A few teraflops from a handheld will look just fine on a tiny screen at 720p. But a desktop’s best model throws dozens of them at 4K resolution; they need a lot more raw throughput to achieve equivalent frame rates. The comparison grid should help put things into perspective.
Did you buy enough compute headroom to get further into games down the road? Or did you max out on your return on investment and reach less value for every extra dollar spent? It’s also a way to understand your way around the variables. Suddenly hardware isn’t about chasing the biggest number, it’s about how many can be delivered in real world under load.
It’s not as complicated as the raw math, but it takes some care to apply. Once you get used to real world efficiency and sustained clock adjustments, then the teraflop count stops being a trap for marketers and becomes a useful tool. Strip away the peak potential and look at the sustained reality. Then, the numbers begin to make sense.