🧠 Memory Bandwidth Calculator
Calculate theoretical and effective memory bandwidth from DDR generation, MT/s transfer rate, bus width, channel count, efficiency, interleaving, ECC overhead, and read/write traffic mix.
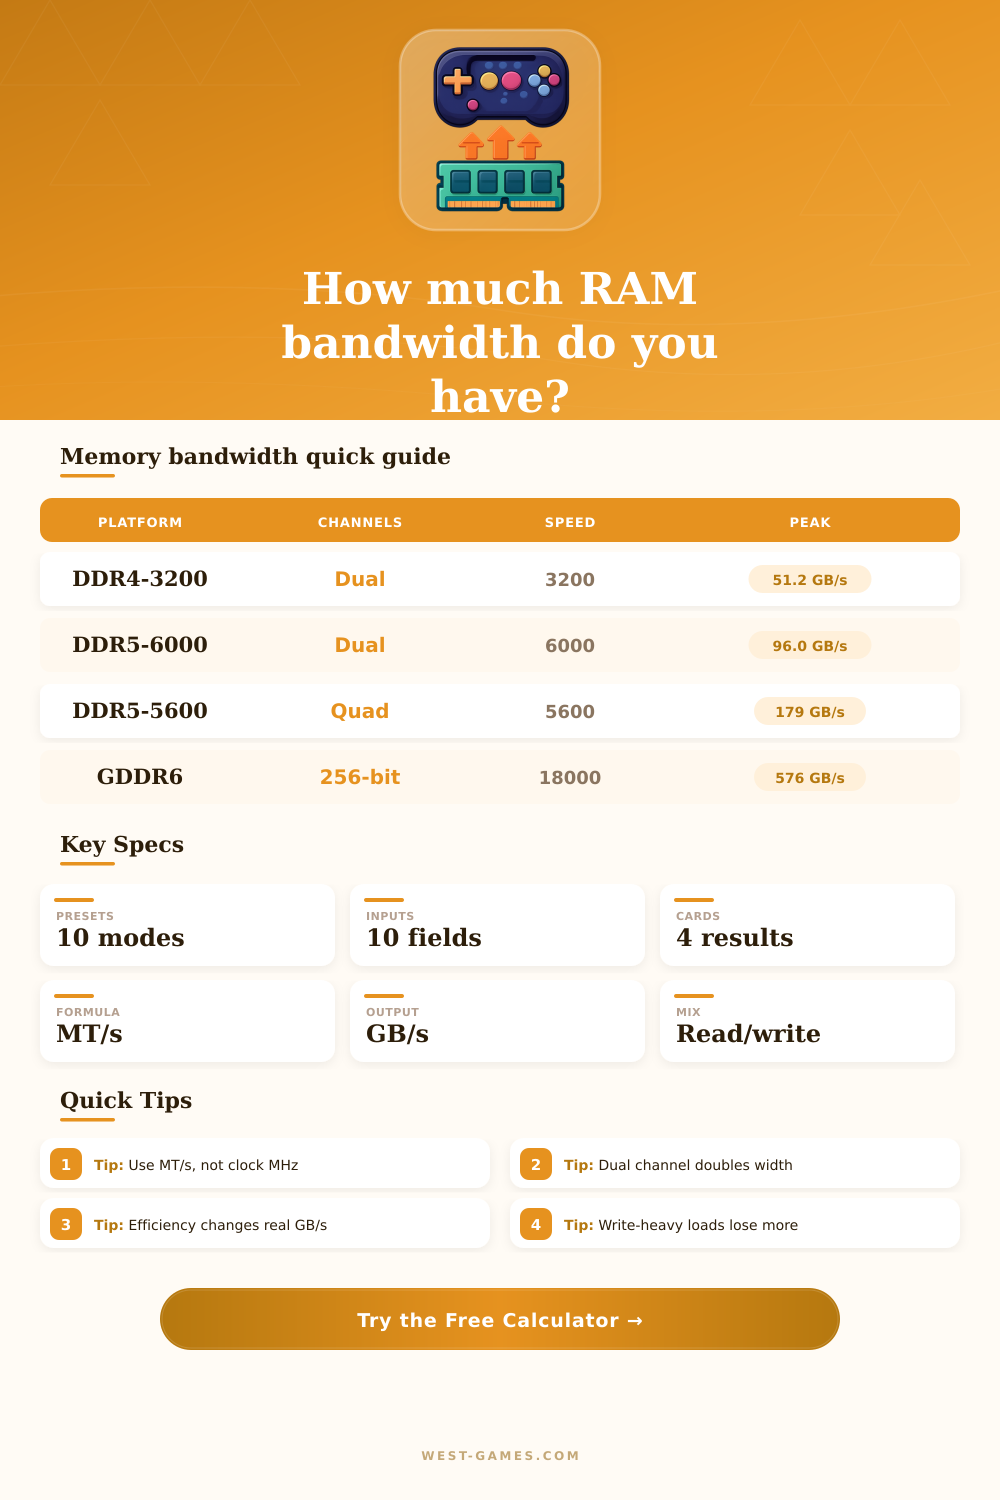
Common dual-channel desktop baseline.
Modern gaming DDR5 reference.
Workstation-style four-channel peak.
Graphics memory bus comparison.
| Generation | Common MT/s | Single 64-bit channel | Dual-channel peak |
|---|---|---|---|
| DDR3 | 1333 to 2133 | 10.7 to 17.1 GB/s | 21.3 to 34.1 GB/s |
| DDR4 | 2400 to 3600 | 19.2 to 28.8 GB/s | 38.4 to 57.6 GB/s |
| DDR5 | 4800 to 7200 | 38.4 to 57.6 GB/s | 76.8 to 115.2 GB/s |
| LPDDR5X | 6400 to 8533 | 25.6 to 34.1 GB/s per 32-bit pair | 102.4+ GB/s at 128-bit |
| GDDR6 | 14000 to 20000 | 56 to 80 GB/s per 32-bit chip group | 448 to 640 GB/s on 256-bit |
| Layout | Width model | Total width | What to enter |
|---|---|---|---|
| Single-channel DDR | 1 x 64-bit | 64-bit | 64 bits, 1 channel |
| Dual-channel DDR | 2 x 64-bit | 128-bit | 64 bits, 2 channels |
| Quad-channel DDR | 4 x 64-bit | 256-bit | 64 bits, 4 channels |
| LPDDR 128-bit | 4 x 32-bit | 128-bit | 32 bits, 4 channels |
| GPU 256-bit bus | 1 total bus | 256-bit | 256 bits, 1 channel |
| Pattern | Typical factor | Why it changes | Calculator use |
|---|---|---|---|
| Sequential stream | 1.00 | Long reads or copies can keep channels busy. | Best-case sustained traffic. |
| Mixed gaming and apps | 0.92 | CPU, GPU, and background traffic compete. | Good default for gaming PCs. |
| Render / compile burst | 0.88 | Bursty reuse and cache misses mix together. | Creator and build workloads. |
| Random small blocks | 0.72 | Bank conflicts and poor locality reduce use. | Databases and scattered access. |
| Latency-limited thread | 0.55 | One thread may wait on latency before filling bandwidth. | Game main-thread style loads. |
| Read mix | Write mix | Common example | Bandwidth note |
|---|---|---|---|
| 90% | 10% | Asset streaming, AI inference, texture reads. | Usually close to read bandwidth behavior. |
| 70% | 30% | Gaming plus multitasking default. | Balanced estimate with mild write pressure. |
| 50% | 50% | Copy, encode, compression, staging. | Turnaround penalty matters more. |
| 30% | 70% | Capture, logging, heavy writeback. | Write drains can lower sustained throughput. |
| 10% | 90% | Write-heavy synthetic tests. | Often far below theoretical peak. |
| Preset | Generation | MT/s | Width x channels | Theoretical peak | Use case |
|---|---|---|---|---|---|
| DDR3-1600 Dual | DDR3 | 1600 | 64-bit x 2 | 25.6 GB/s | Older desktop or retro gaming platform. |
| DDR4-3200 Dual | DDR4 | 3200 | 64-bit x 2 | 51.2 GB/s | Common mainstream gaming baseline. |
| DDR4-3600 Tuned | DDR4 | 3600 | 64-bit x 2 | 57.6 GB/s | Tuned DDR4 desktop profile. |
| DDR5-5600 Dual | DDR5 | 5600 | 64-bit x 2 | 89.6 GB/s | Modern JEDEC-style desktop memory. |
| DDR5-6000 EXPO | DDR5 | 6000 | 64-bit x 2 | 96.0 GB/s | Common gaming sweet spot estimate. |
| DDR5-7200 OC | DDR5 | 7200 | 64-bit x 2 | 115.2 GB/s | High-transfer-rate enthusiast profile. |
| Quad DDR5 Workstation | DDR5 | 5600 | 64-bit x 4 | 179.2 GB/s | Workstation and HEDT-style bandwidth. |
| 8-Channel DDR5 Server | DDR5 | 5600 | 64-bit x 8 | 358.4 GB/s | Server memory controller example. |
| LPDDR5X 128-bit | LPDDR5X | 7500 | 32-bit x 4 | 120.0 GB/s | Mobile APU or handheld-class memory. |
| GDDR6 256-bit GPU | GDDR6 | 18000 | 256-bit x 1 | 576.0 GB/s | Graphics memory bus comparison. |
That’s why you probably purchased that speedy RAM after watching some benchmark clip online where it was rendering frames more smoothly. After all, memory seems like it would be all about how many bits flow between processor and the stick every second, right? Yeah, that’s the headline number everybody throws out, typically measured in gigabytes per second.
But here’s the issue: Max bandwidth is largely a marketing number based off ideal conditions. Ideal conditions do not exist inside your PC, except perhaps when you’re running one of those synthetic tests meant to touch only sequential blocks of memory. In reality, applications, background tasks, and games all hop around randomly in the address space.
Real RAM Speed vs Marketing Numbers
Plug in your exact mix of channels, transfer rate, and generation. The calculator above do the math for you so you don’t have to guess what percentage of that peak speed you’ll end up using.
Let’s start there: Dual channel and quad channel does not simply increase speed. They multiply it. They open additional lanes on the highway. For example, if you have a single stick of DDR5 running at 6000 MT/s, that’s as fast as that one lane can go. Add a matched pair of sticks, and suddenly total bus width doubles. That’s why everyone recommends buying memory in pairs!
So then, if you’ve got two lanes open, you should of be able to fill ’em, right? No, actualy. Because the controller has to service CPU requests, and those typically comes in brief spurts rather than sustained streams. That’s where efficiency comes into play. Adjusting the efficiency percentage in the tool allow you to model your actual usage pattern. A sequential copy job might reach ninety-five percent of its possible limits, while a random database query might only hit say, seventy percent, due to latency overhead and bank conflicts.
Second, the read versus write mix add another dimension to it. Game workloads is mostly read heavy when it comes to pulling textures, models and other game assets off memory. Writes occur less frequently. There is a bit of a penalty because the bus need to switch directions or the write buffers need to be drained before reads can resume. If your workload contains a 50% read/write split, you’ll notice a significant drop in your sustained throughput compared to a 90% read case. The calculator breaks this down into both numbers so you know precisely how much bandwidth is available in either direction.
It matters far more then you’d expect if you’re doing simulations, or video editing with constant writing back to memory.
And finally: what about generational transitions? Sure, going from DDR4 to DDR5 means running at higher clocks. But the architecture also shifts, each rank has its own split data bus made up of two thirty-two-bit channels instead of one sixty-four. That provides greater granularity for access pattern, reducing latency despite potentially equal raw peak bandwidth (though you can see that in the page’s reference table where it compare typical desktop configs vs. Servers and workstations). A gaming system with dual channel will never keep pace with a server node with eight channels, not because the former runs on faster sticks, but because the latter have orders of magnitude more lanes dedicated to handling traffic.
And lastly, there is the diminishing returns of extreme overclocking. Sure, getting your DDR5 to 7200 MT/s or beyond sounds cool … until you check out what’s happening in your CPU’s memory controller. Often, looser CAS latencies is necessary at higher frequencies, and this can negatively impact performance when you’re doing something latency sensitive like playing games. This is where you’ll be able to use these tools to tweak things and see where your particular chip has its sweet spot.
Not everyone are trying to hit the largest number possible here. They are looking to hit the most usable amount of bandwidth. Understanding how traffic direction, efficiency and even channels all play into this will help you get away from chasing marketing specs and really build something with hardware that performs well under load. It’s all about matching the workload to the hardware, not just the clock speed.