Storage Read Time Calculator
Estimate effective game load time from install size, sequential read speed, random access penalty, queue depth, cache hits, and decompression throughput.
7200 RPM estimate with strong seek penalty and little queue benefit.
Good baseline for older gaming PCs and external SATA enclosures.
Fast storage case where decompression may become the cap.
Compares the selected model against the slowest reference result.
| Drive type | Typical read | Random behavior | Practical note |
|---|---|---|---|
| 7200 RPM HDD | 100 to 180 MB/s | Very weak small reads | Long seeks can dominate game startup and area streaming. |
| SATA SSD | 450 to 560 MB/s | Strong low queue reads | Often removes the worst hitching from HDD-era installs. |
| NVMe PCIe Gen3 | 2400 to 3500 MB/s | Excellent parallel reads | Good match for modern game launch and texture streaming. |
| NVMe PCIe Gen4 | 5000 to 7400 MB/s | Excellent parallel reads | Often shifts the bottleneck to CPU, engine work, or decompression. |
| UHS-I microSD | 70 to 100 MB/s | Limited random reads | Playable for many handheld libraries but slower for patch and shader churn. |
| Pattern | Penalty | Overhead | Where it appears |
|---|---|---|---|
| Large sequential stream | 0 to 8% | Low | Big packed archives, video, and contiguous level bundles. |
| Mixed game assets | 10 to 30% | Medium | Common open-world loads with textures, meshes, audio, and metadata. |
| Many small files | 30 to 70% | High | Loose-file mods, patch verification, and old launchers. |
| Shader or cache rebuild | 15 to 45% | Very high | Compiling, validation, and CPU-side setup after driver changes. |
| Network or external latency | 20 to 60% | High | NAS libraries, USB bridges, and power-managed external drives. |
| Queue depth | HDD gain | SATA gain | NVMe gain |
|---|---|---|---|
| QD 1 | Baseline | Baseline | Baseline |
| QD 2 to 4 | Small | Moderate | Strong for packed game reads |
| QD 8 to 16 | Seek-limited | Near peak | Often reaches practical game-loading peak |
| QD 32+ | Noisy gain | Limited gain | Benchmark-friendly, not always game-realistic |
Queue depth here is modeled as a practical efficiency multiplier, not a synthetic benchmark peak.
| Decompression path | Throughput | Likely cap | Load symptom |
|---|---|---|---|
| Older quad-core CPU | 400 to 900 MB/s | CPU | SSD is busy in bursts, CPU stays high. |
| Modern desktop CPU | 1500 to 4000 MB/s | Mixed | NVMe helps, but gains taper on very fast drives. |
| Hardware decompression path | 4000 to 9000 MB/s | Storage or engine | Fast level swaps when assets are packed well. |
| Modded loose assets | Varies widely | Random I/O | Small file count dominates before raw MB/s matters. |
| Scenario | Read size | Drive speed | Penalty | Best interpretation |
|---|---|---|---|---|
| HDD open world | 52 GB | 140 MB/s | 62% | Worst-case library migration estimate from spinning storage. |
| SATA SSD RPG | 38 GB | 530 MB/s | 20% | Common older PC SSD baseline with mixed packed assets. |
| NVMe Gen3 shooter | 42 GB | 3200 MB/s | 18% | Balanced modern PC storage and CPU decompression case. |
| NVMe Gen4 texture pack | 88 GB | 6900 MB/s | 11% | Large high-resolution assets where decoding can cap load time. |
| Handheld microSD | 24 GB | 90 MB/s | 36% | Portable library estimate with limited random read throughput. |
The loading screen stretches ahead of you like forever, seemingly unending as you press play on some sprawling open-world game. You think maybe your computer’s got a problem. But more often than not, things are simpler: Your drive is simply overloaded with a certain kind of load.
Hard drives and solid-state drives is typically measured by single number on the packaging, typically the maximum sequential read rate. This measures how quickly the drive can handles moving a single large file along a straight path. What does this have to do with anything? Almost nothing. Which is where folks mess up.
Why Games Take So Long to Load
Video files aren’t like games. When they are loaded, they do not behave like videos. They assemble like a puzzle made of thousands of randomly dropped puzzle pieces. We’ve got this raw throughput, but there is friction involved in reading them as random access file. There is also all this additional processing required to uncompress these assets.
And that’s where the calculator does the work for you, tallying the raw number against the power needed to process it and factor in the random access penalty. That random penalty are expressed as a percentage. It represents how much extra work the system do while the drive head moves to find new places to look, or while the SSD controller deals with many small I/O requests at once. It doesn’t matter how fast your drive can go sequentially if each byte need its own command. This happens if it is stored somewhere else entirely on the platter or even just the chip.
Finally, there’s the decompression phase, also known as the hidden-in-plain-sight stage. To save bandwidth and disk space, moddern games are shipped with compressed files. Before they’re rendered on GPU, those files need to be unpacked by your CPU. This means if your processor isn’t fast enough to keep pace with your drive as it reads its data out, then your storage will sit idle until the CPU plays catch-up. This is why upgrading from a fast SATA SSD to an ultra-fast NVMe drive sometimes results in a few seconds improvement in load times. The bottleneck’s simply been moved from the disk to the silicon. By measuring how long it takes to read vs how long it takes to decompress, the tool can help you determine which stage is holding everything back.
Queue depth is also another factor, and it’s far more important then you may realize. Essentially, if your drive has a deeper queue depth, it’s able to handle several read requests that are pending, in an optimal sequence; not one after the other. Because solid state drives have the ability to do several operations at once, this is right up their alley. On the other hand, mechanical hard drives chokes on this stuff. As queue depth goes up, so does the chaos of head movements for a spinning disk. And if you’re still running with a mechanical drive as your active gaming library, there isn’t any queue tuning in the world that can make up for physical limitations of rotating platters.
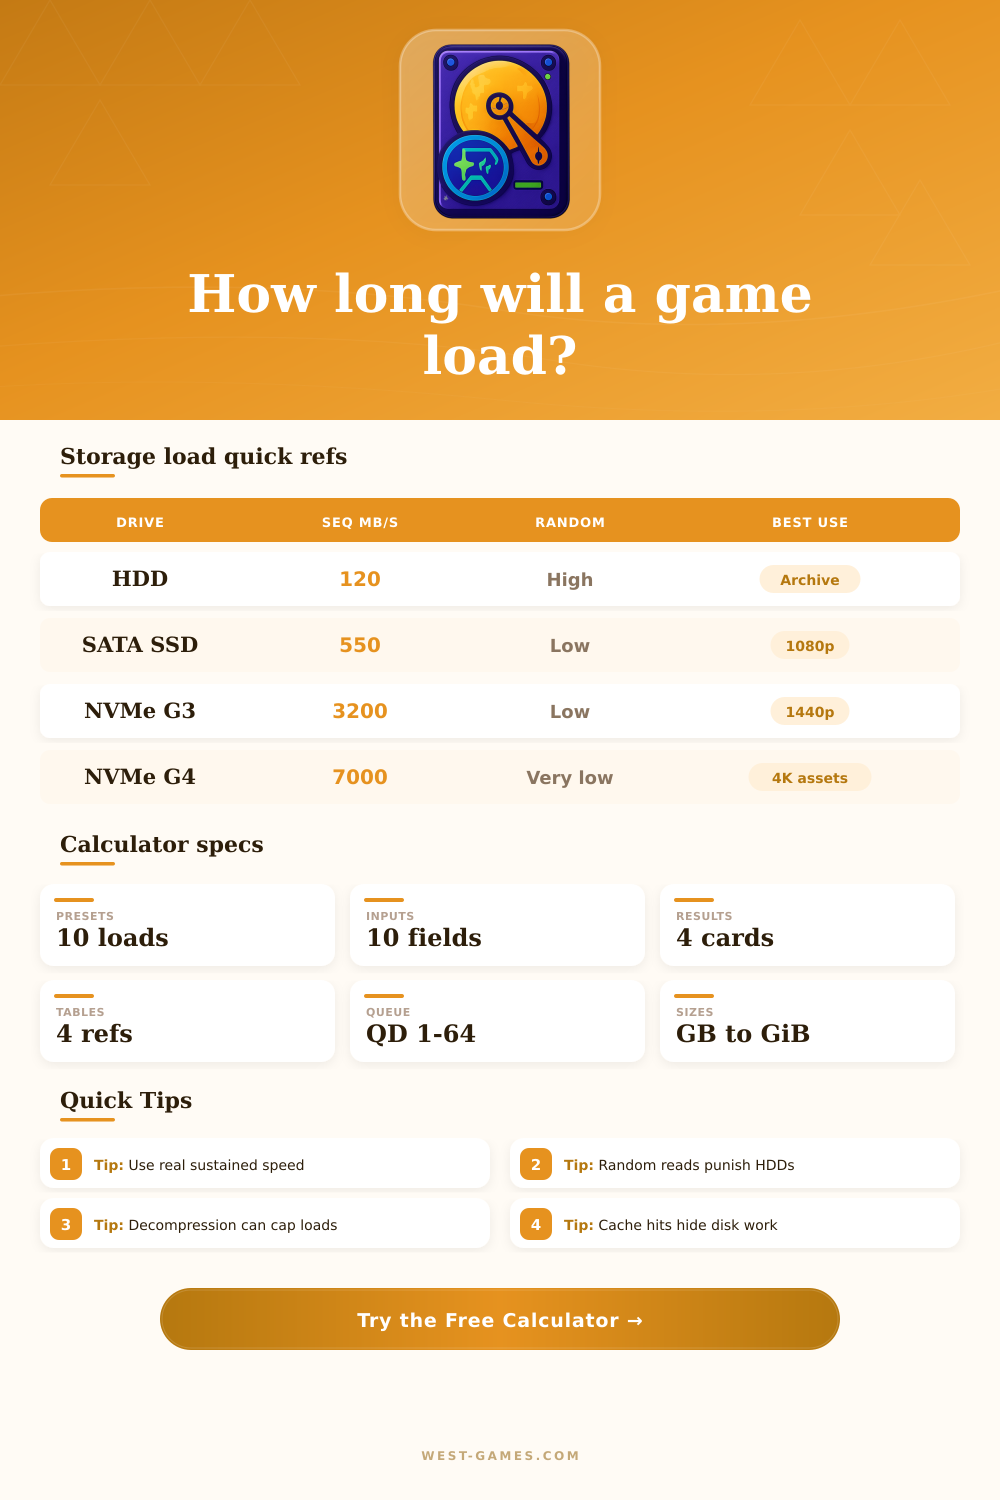
The table of references on the page breaks all of this down nicely, illustrating which drive types really excel (or don’t) in practical use cases. That knowledge shapes your upgrade strategy. If your CPU can’t match the data throughput of a high-end drive, it’s a waste of cash to purchase the fastest one on the market. It may make more sense to invest in a mid-tier solid state drive. You should also equip your rig with sufficient RAM so that frequently accessed assets are cached in memory, eliminating many read operations while playing. Because cache hits never hit the bottleneck of storage, they’re hugely important. The moment engine retrieves data from memory instead of the disk, load times dissapears.
So while it’s great to optimize for best case scenarios, ultimately load time optimization is more about balancing the different parts of a pipeline than it is chasing a benchmark number. Your goal is to have memory, processing, and storage all working together, not stepping on each other’s toes. Those numbers let you know where the traffic jam is happening and what the underlying issue actualy is, allowing you to fix it, rather than guess. You learn that raw speed isn’t everything and that things like random access and decompression penalties are also important issues. Suddenly, those loading screens aren’t a mystery anymore but an engineering problem with obvious solutions.
The data flows smoothly, you press play, and you could of just played the game without wondering if you made the right choices in your life.