🔌 PCIe Lane Bandwidth Calculator
Estimate PCIe payload bandwidth from generation, lane count, encoding overhead, protocol overhead, workload demand, duplex traffic, and saturation margin for GPUs, NVMe SSDs, network cards, capture cards, and add-in adapters.
Your selected generation, active lanes, and overhead settings.
Common when a GPU slot runs x8 or an M.2 adapter is lane-limited.
Shows the penalty from dropping the same lane width by one PCIe generation.
Shows the upside if the device and motherboard both negotiate faster signaling.
| Generation | Transfer rate | Encoding | Usable per lane |
|---|---|---|---|
| PCIe 1.0 | 2.5 GT/s | 8b/10b | 0.250 GB/s |
| PCIe 2.0 | 5.0 GT/s | 8b/10b | 0.500 GB/s |
| PCIe 3.0 | 8.0 GT/s | 128b/130b | 0.985 GB/s |
| PCIe 4.0 | 16.0 GT/s | 128b/130b | 1.969 GB/s |
| PCIe 5.0 | 32.0 GT/s | 128b/130b | 3.938 GB/s |
| PCIe 6.0 | 64.0 GT/s | PAM4 + FLIT/FEC | about 7.56 GB/s |
Values are one direction before the extra protocol overhead input. PCIe can transmit and receive at the same time.
| Link | x1 | x4 | x16 |
|---|---|---|---|
| PCIe 2.0 | 0.50 GB/s | 2.00 GB/s | 8.00 GB/s |
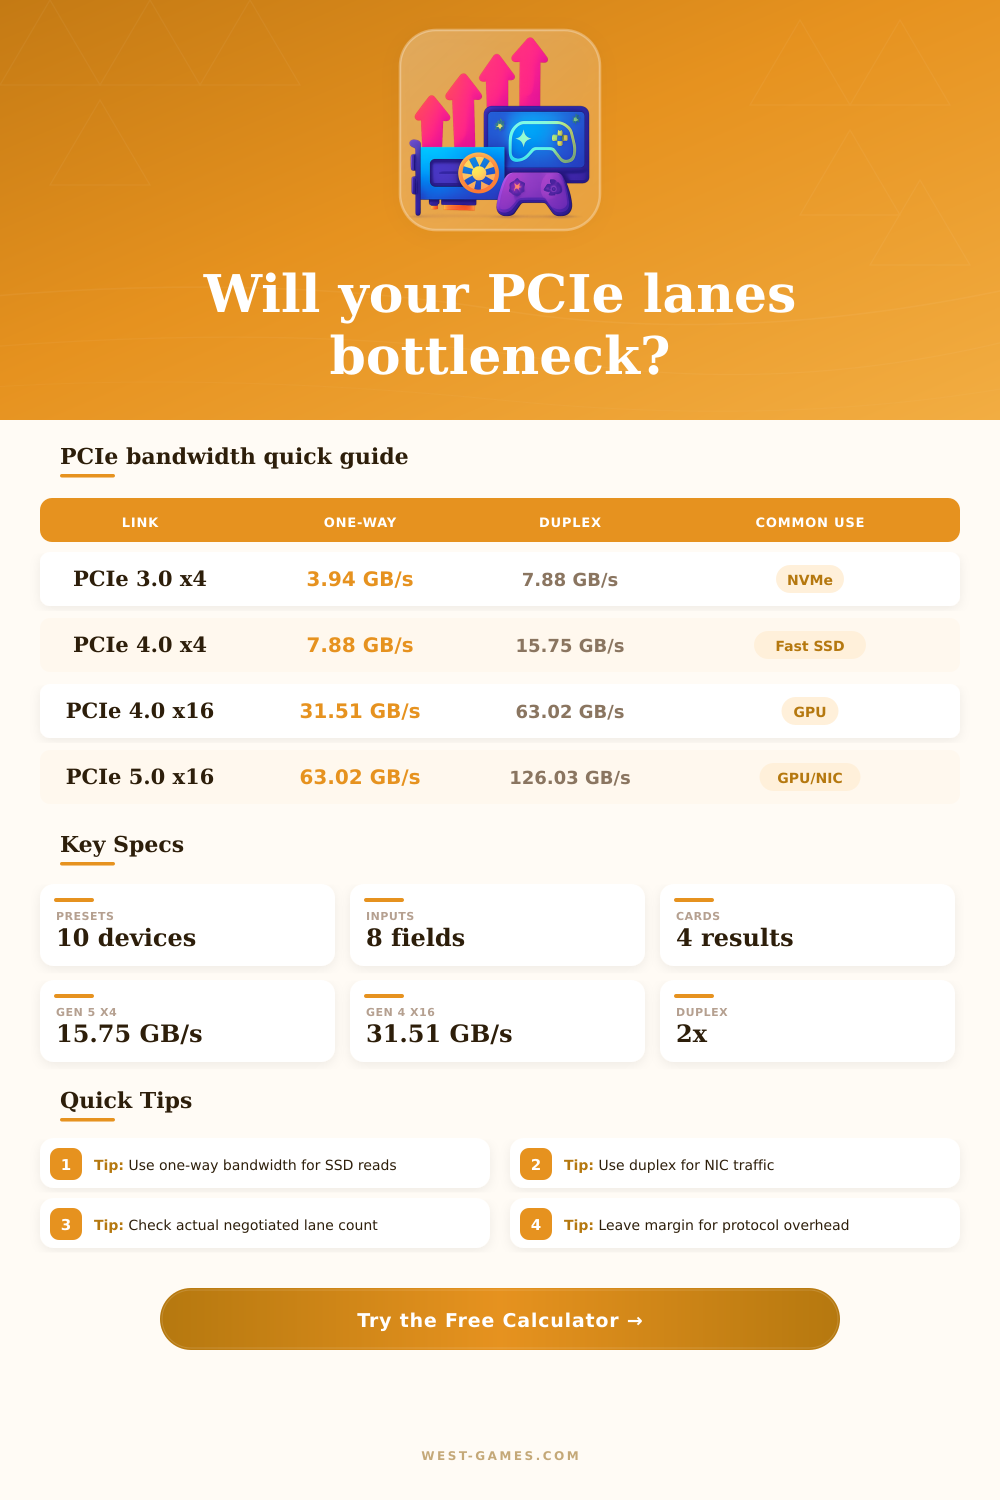
| PCIe 3.0 | 0.98 GB/s | 3.94 GB/s | 15.75 GB/s |
| PCIe 4.0 | 1.97 GB/s | 7.88 GB/s | 31.51 GB/s |
| PCIe 5.0 | 3.94 GB/s | 15.75 GB/s | 63.02 GB/s |
| PCIe 6.0 | 7.56 GB/s | 30.24 GB/s | 120.96 GB/s |
The calculator uses exact decimal math internally, then subtracts your protocol overhead for effective payload planning.
| Device | Typical link | Demand signal | Margin note |
|---|---|---|---|
| Gaming GPU | x16 or x8 | Usually bursty, not constant | x8 can be fine on newer generations. |
| NVMe SSD | x4 | Sequential read/write rating | Large file copies and scratch disks care most. |
| 10/25 GbE NIC | x1 to x4 | Line rate converted to GB/s | Use duplex if sending and receiving together. |
| 100 GbE NIC | x8 or x16 | 12.5 GB/s per direction before overhead | Older x8 links can be tight. |
| Capture card | x4 or x8 | Raw or lightly compressed ingest | Use one-way payload for ingest lanes. |
Real devices may bottleneck on controller, firmware, memory, CPU, chipset uplink, or thermals before PCIe bandwidth is exhausted.
| Free margin | Status | Meaning | Action |
|---|---|---|---|
| 50%+ | Very open | Workload uses less than half the payload | PCIe bandwidth is unlikely to be the limiter. |
| 25-49% | Comfortable | Useful headroom for bursts and overhead | Good target for gaming and general storage. |
| 10-24% | Tight | Small changes can saturate the link | Check real transfer traces and lane negotiation. |
| 0-9% | Near limit | Payload is almost full | Reduce demand or use more lanes/generation. |
| Below 0% | Saturated | Demand exceeds calculated payload | Expect throttled transfers or queued traffic. |
Use a larger target margin for workloads with short bursts, many small transactions, or simultaneous devices behind a chipset link.
| Preset | Link | Demand | Use case | Best check |
|---|---|---|---|---|
| RTX GPU Gen4 x16 | PCIe 4.0 x16 | 8 GB/s | GPU | Compare x16 vs x8 for small performance deltas. |
| GPU Gen4 x8 | PCIe 4.0 x8 | 8 GB/s | GPU | Useful for compact boards and shared-lane slots. |
| NVMe Gen4 x4 | PCIe 4.0 x4 | 7.2 GB/s | NVMe | Sequential reads can approach the link ceiling. |
| NVMe Gen5 x4 | PCIe 5.0 x4 | 13.5 GB/s | NVMe | Thermals and controller limits often matter too. |
| 100 GbE NIC | PCIe 4.0 x8 | 12.5 GB/s | NIC | Full-duplex workloads need receive and transmit room. |
| SSD RAID Adapter | PCIe 4.0 x16 | 24 GB/s | Storage | Queue depth and chipset uplink can dominate. |
Webhook row marker: index 959, gid 1450490472. Presets are editable planning assumptions, not brand-specific performance guarantees.
When you shell out for a high-end NVMe drive or a graphics card, you’re paying for performance. But that hardware rely on the interface it connects through. That sleek-looking rectangle on your motherboard (the PCIe slot) actualy represents a huge array of encoding, lane, and generation rules, which define how your component perform, whether it hits its rated potential, or falls back to half-speed.
If you plug a device into your machine and think it’s performing up to spec, you’d be wrong most of the time: Unless your system support the component’s specs, it won’t perform as advertised. That’s where the calculator comes in: It will tell you what your true available bandwidth is, taking into account the cost of the protocol and encoding overhead.
How to Stop Your PC from Running Slow
That way you can tell the difference between the raw transfer rate and amount of data actualy being sent. While a card might have a theoretical maximum of 31 gigabytes per second, it is not actually sending that much. Some portion of that capacity are used for framing data and other bits that help ensure correct transmission between CPU and whatever device it is connected to. Knowing that difference means you won’t overpay for something simply because there is a generation mismatch or your motherboard doesn’t support as many lanes as the card itself do.
The third bottleneck is lane count. This one can sneak up on you because it’s usually something your motherboard does behind the scenes. Many of today’s motherboards will take a single 16-lane connection from a high-end GPU and divide it into several different things, such as more SATA ports, USB controllers, or even M.2 storage slot. If your M.2 drive happens to share a lane with your PCIe slot, for instance, your graphics card could be running at eight lanes without any warning.
In that case, you may not lose much gaming performance… Though you might start noticing some stutter when texture streaming can’t quite keep up with your frame rate. That’s where this tool comes in. It gives you the option to run your system at x16, x8, etc., allowing you to determine how much headroom you have when sharing the connection.
There’s also some confusion around generational differences, since backwards compatibility doesn’t equal performance. For example, you can put a PCIe 5.0 card into a PCIe 3.0 slot, but it will only operate at PCIe 3.0 speeds. That effectively halves or quarters its potential bandwidth depending on the specific components involved. You can use the calculator to model that performance downgrade by choosing an older gen, with the same number of lanes; it’ll show you exactly how much you’re losing by mixing and matching newer and older components.
It’s just a little bit of math to help you avoid getting a drive that can’t achieve advertised sequential read speeds because your mobo is two generations out. Finally, there’s protocol overhead which most people don’t consider. Data packets also include transaction management and flow control headers, on top of any line coding efficiency. Use this calculator and tweak that protocol overhead based off workload (e.g., big sequential streams vs. These include tiny random writes.
For serious users with a high-end network interface card managing continuous two-way traffic, duplex bandwidth matter. Make sure you’ve got enough space so download data can fly back while uploading at the same time without queuing up and making it take longer.
Saturation margin is one of the more useful metrics for everyday use because it gives you an idea of how close you are to maximum bandwidth. With a generous saturation margin, if something else decides to do some data chewing in the background, your system will have time to breathe. If the margin is tight, then every extra thing that tries to access the network might begin throttling things down. As such, you want enough headroom where the maximum load never hits exactly full blast, otherwise, you’ll start getting stuttered transfers and dropped frames, etc.
There are reference tables on the page which help put things into perspective; they give quick benchmarks of popular devices. Can you fit your setup into the safe operating margins? However, PC builds is all about striking this balance. Rather than pursuing as many numerical values on a spec sheet as possible, it’s important to recognize when you don’t actually require the fastest link for your use case.
However, you also definitely don’t want to inadvertently bottleneck yourself… Wasting both your own time and money in the process. Visualize the bandwidth demand from your workload compared to what is available. This will help you understand which components works together and how to design your system to run as fast as possible without falling behind.
It may be a narrow road, but with proper calculation, you’ll know exactly how fast your hardware will go… And that it won’t get left behind. You should of checked the lanes first.