💎 StarCraft Mineral Income Calculator
Estimate mineral income from worker count, patch count, saturation, travel time, base count, MULE calls, macro boost, projected worker growth, and time to a mineral target.
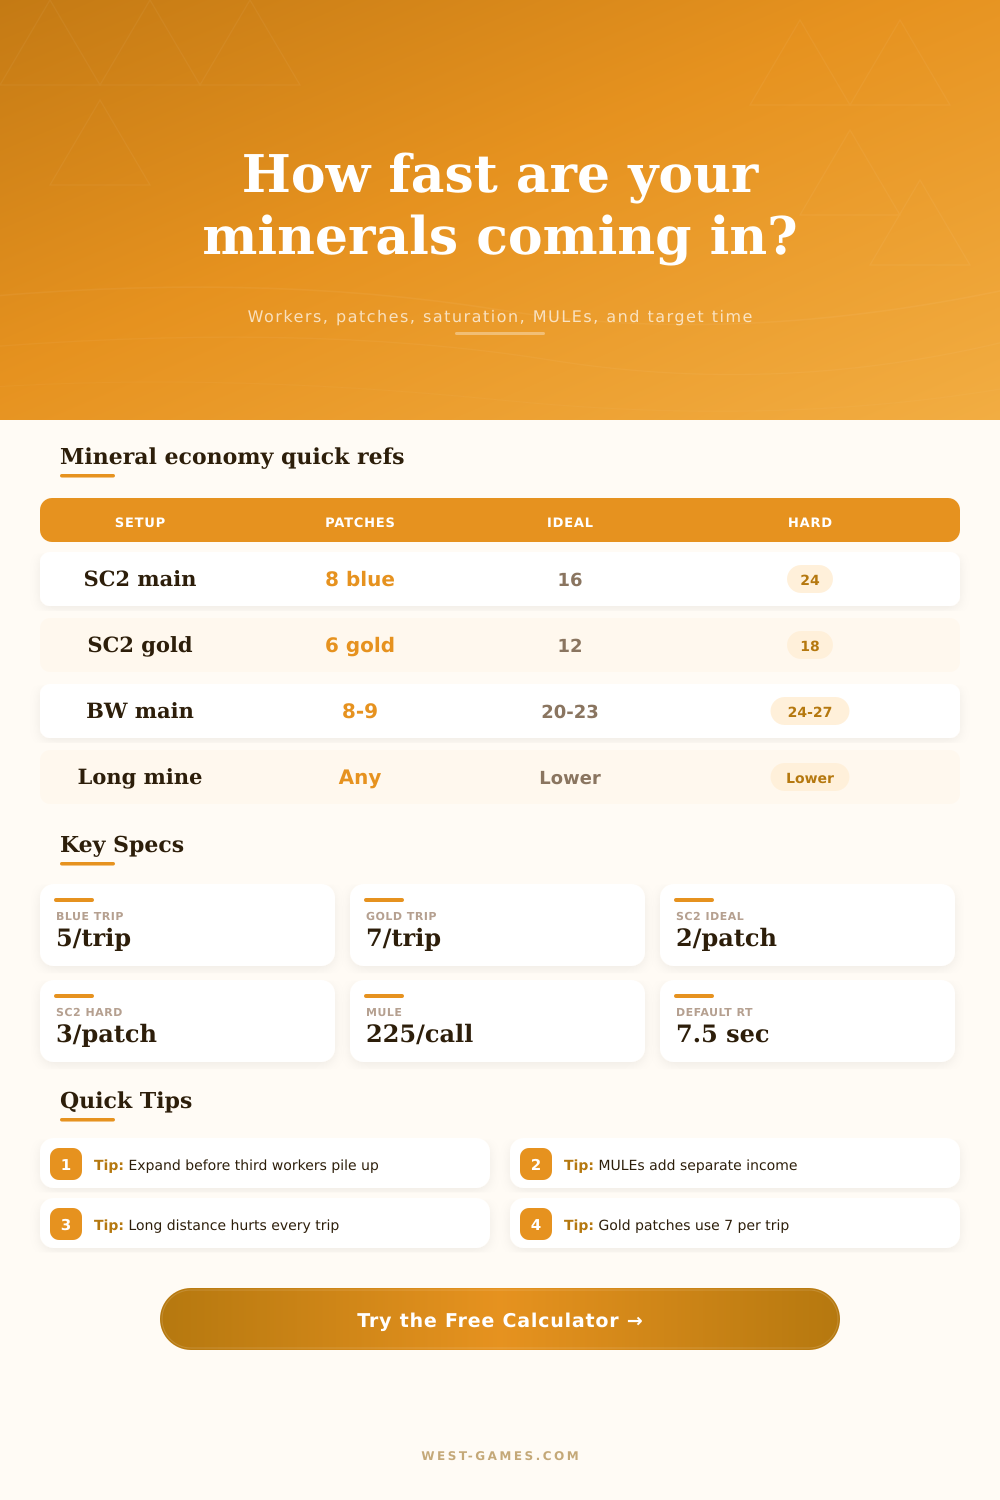
| Mineral setup | Patch count | Efficient workers | Hard workers | Calculator note |
|---|---|---|---|---|
| StarCraft II standard blue base | 8 patches | 16 workers | 24 workers | Default setup for ladder-style income checks. |
| StarCraft II gold base | Often 6 patches | 12 workers | 18 workers | Use 7 minerals per worker trip and watch patch count. |
| Brood War natural or main | Usually 8-9 patches | About 2.5 workers per patch | About 3 workers per patch | Patch geometry matters more, so tune round-trip time. |
| Long-distance mineral mining | Any visible patches | Lower practical count | Traffic limited | Increase round-trip time and travel penalty together. |
| Mechanic | Default value | Why it matters | When to change it |
|---|---|---|---|
| SC2 blue mineral cargo | 5 minerals per trip | Turns round-trip time into minerals per minute. | Change for gold minerals, campaign, co-op, or custom maps. |
| SC2 gold mineral cargo | 7 minerals per trip | Gold fields raise income without changing worker count. | Use only when the selected base really has high-yield fields. |
| Efficient saturation layer | 2 workers per patch | The first two workers do most of the reliable mining. | Keep this at 2 for normal SC2 mineral lines. |
| Third worker layer | 50% default efficiency | The third worker queues at the patch and adds reduced income. | Raise or lower after measuring a specific map or replay. |
| MULE income | 225 minerals per call | MULEs are separate direct income, not normal worker saturation. | Use 200 for conservative LOTV timing or 270 for older eras. |
| Macro production boost | Worker ramp only | Chrono and larva mechanics improve future worker count. | Set to 0 if you only want current income. |
| Preset | Game idea | Starting inputs | Best result to watch |
|---|---|---|---|
| SC2 Main 16 Workers | Clean one-base saturation | 8 patches, 16 workers, 5 cargo | Minerals per minute and target time. |
| SC2 Main 24 Workers | Over-saturated main | 8 patches, 24 workers, weak third layer | Third worker value and transfer signal. |
| Two Base 32 Workers | Two saturated mineral lines | 16 patches, 32 workers | Expansion income and spending pace. |
| Terran MULE Cycle | Orbital Command economy | Workers plus MULE calls per minute | MULE share of total income. |
| Protoss Chrono Probe Ramp | Chrono-assisted worker growth | Boosted worker production rate | Projected minerals over time. |
| Zerg Inject Drone Ramp | Larva-backed drone surge | High worker growth into new bases | Time to fill efficient saturation. |
| Long Distance Mining | Mining without a town hall | Long round trip and penalty | Lost MPM from travel. |
It’s five minutes until the timer and your resource count is rising, but your mineral count isn’t. You don’t have enough resources to construct that new technology unit. You’re out of minerals, but you aren’t losing the game.
What does this mean? That’s where the calculator comes in. It crunches numbers so you don’t have to. It makes the abstract world of economics concrete in terms of seconds. Understanding what your economy can sustain will often be the difference between winning or losing. Look at reality, not hope.
Use the Calculator to Win the Game
Saturation is treated by most player as a raw body count. More bodies = constant increase in income. Wrong.
The initial pair of miners on every mineral patch are efficient. They have unblocked paths. They don’t wait on each other. The third miner isn’t like that. The third miner spends a lot of time waiting for the previous two to finish their trips. The first two miners is highly efficient and don’t have any queueing delays. So your total output per patch drop off, because all those miners are burning time while waiting. The chart on that page is quite clear about it: after two workers your income curves level out.
Know the dip. It informs you where you ought to expand, and when you shouldn’t. Don’t waste more people in same holes.
Many players forget about travel time as well. The longer the miner has to walk from the base to the mine and back, the less income he earn. If you have long distance mineral patches on a map, it increases the time spent traveling back and forth. This slashes your income per minute, even if you saturate perfecty. Sure, you may have twenty workers at your base. But if they’re spending half their time walking, you’re effectively making as much money as you would with ten workers. The calculator will help you adjust for travel penalties so you can see what the true cost is. Bad splits and poor base placement all has a cost. It’s small, but it matters.
That changes things when you look at race specific boosts. MULEs boost the terran player. Chrono Boost speeds up construction for protoss players. Injects allow zerg players to swarm the board with drones. These are not bonuses. They’re structural advantages that basically shift baseline math. The calculator factors these in. It views MULEs as separate income sources. Chrono Boost acts as a rate of worker growth. This is important because it’s a difference between sustainable economic foundations and temporary income spikes.
How you earn your money informs how you spends that money. Is your income coming from direct mineral production? Or additional workers? Your spending habits is another major factor that determine your results. You don’t want to hoard minerals. That’s not really a winning strategy. And you certainly don’t want to spend them blindly.
Enter the amount of minerals you want, along with what you currently have in the bank, into the tool. Then it’ll show you exactly how long it will take before you can justify building whatever it is you plan on building. And it will force you to face facts. Is that as long or longer than your opponent’s attack? If so…you’ve got problems.
Because I am afraid this tool is a rough mirror, but it’s an honest one. Ultimately, this isn’t just about crunching numbers. This is developing a mental model of your economy. Knowing the trade-offs means you don’t guess anymore. You plan. The trade-offs include macro boosts, travel efficiency, and saturation depth. Then you realize that game becomes a sequence of calculated moves. It is not a sequence of reactions.
Next time you’re under the pressure of a stalling economy, you’ll know what lever to pull. How to get things moving again. It’s all about controlling the flow. And you control it one mineral at a time.