🎲 Elo Odds Calculator
Estimate match win probability, draw pressure, lower-rated upset odds, fair implied odds, and expected score from Elo ratings, side advantage, volatility, and best-of format.
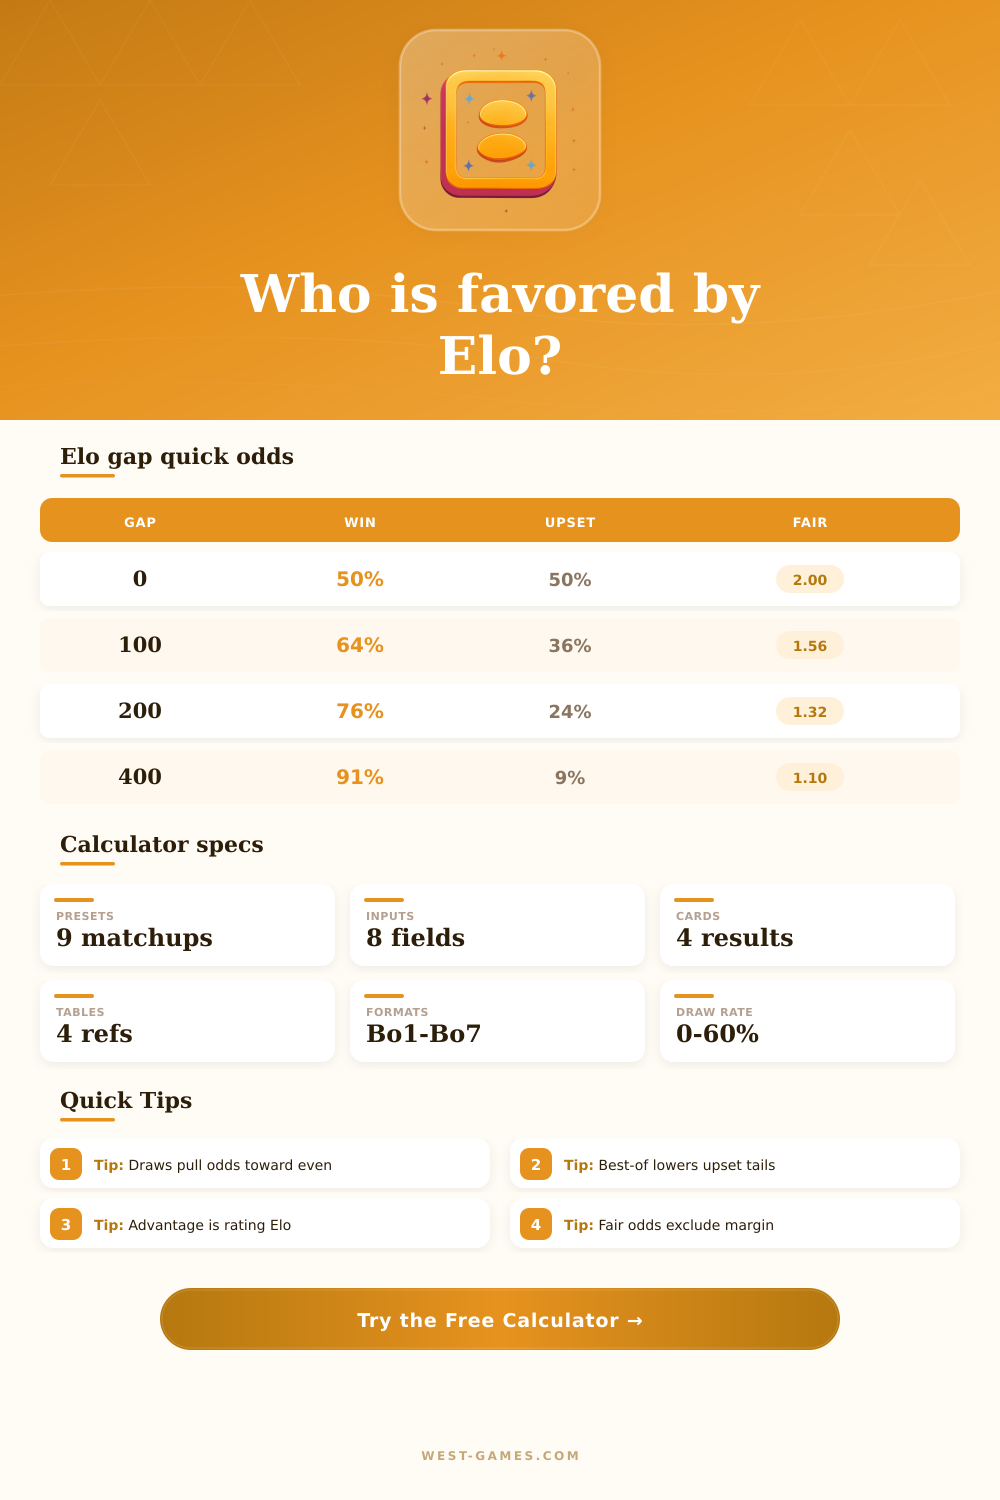
| Effective gap | Expected score | Fair decimal | Read |
|---|---|---|---|
| 0 Elo | 50.0% | 2.00 | Pure toss-up |
| 50 Elo | 57.1% | 1.75 | Small edge |
| 100 Elo | 64.0% | 1.56 | Clear favorite |
| 200 Elo | 76.0% | 1.32 | Strong favorite |
| 400 Elo | 90.9% | 1.10 | Heavy favorite |
These use the normal 400-point Elo scale before draw allocation or best-of adjustment.
| Format | Needed wins | Series win | Upset tail |
|---|---|---|---|
| Best of 1 | 1 | 60.0% | 40.0% |
| Best of 3 | 2 | 64.8% | 35.2% |
| Best of 5 | 3 | 68.3% | 31.7% |
| Best of 7 | 4 | 71.0% | 29.0% |
Longer formats do not remove variance, but they reward repeatable rating edges.
| Probability | Decimal | American | Meaning |
|---|---|---|---|
| 25% | 4.00 | +300 | One in four |
| 40% | 2.50 | +150 | Live underdog |
| 50% | 2.00 | +100 | Even money |
| 60% | 1.67 | -150 | Solid favorite |
| 75% | 1.33 | -300 | Heavy favorite |
The calculator prints no-vig fair odds. Real markets usually include a spread around these numbers.
| Draw rate | Common fit | Odds effect | Use carefully when |
|---|---|---|---|
| 0% | No-draw games | All probability splits | Tiebreak is automatic |
| 2-8% | Esports maps | Small dampener | Overtime varies |
| 15-30% | Board games | Fair odds widen | Draw skill differs |
| 35-60% | Classical chess | Win prices stretch | Color matters a lot |
If one side is especially draw-prone, blend ratings with matchup history rather than using a flat draw rate.
You’re looking at two similar-looking ratings. Both players is around eighteen hundred, so it’s a neck-and-neck game, right? You see the lower rated player gets to play at home, while higher rated player is playing a best of seven instead of a best of one.
It sounds like a miniscule difference, but that’s why Elo systems are dynamic probability engines rather than static snapshots of ability. A rating isn’t a badge of honor it’s simply an expectation based off an initial snapshot. This tool fills in the gap from raw numbers to real world results.
How the Calculator Works
The core math relies on a logistic curve that translates point differences into win percentages. You might think a 100-point spread is huge, but it actualy increases the favorite’s single-game win chance to roughly a 64% chance. That still gives the underdog a 36% shot, plenty of room for chaos to erupt in one game.
Once you input your format and ratings, the calculator do all the math for you, avoiding any mental-math mistakes that could sabotage your lineup choices (or bets). And it eliminates bookie’s cut to reveal implied probability itself. So now you can strip away the money, revealing the matchup’s naked edges.
But most analyses fails on draw rates as they tend to reduce variance in uneven ways. For example, in chess a draw happens frequently and typically indicates both sides could of never broken through after prolonged play. On the other hand, in esports draws is rare unless there are overtime rules, so the pressure is immediate. So if you are inputting a high draw rate, the system will redistribute this probability carefuly.
It’s not splitting the probability evenly since tiebreakers typically favor whoever had the advantage during the match itself. This nuance might make an upset look more likely than it actualy is if you ignore the draw setting. Knowing how to account for deadlocks are key to knowing who really has the edge.
Longer series also eliminate randomness through their natural best-of format: the longer the series go, the more consistent a player must be to succeed. If you have a player who’s won sixty percent of any given game, it gets better and better the deeper into the series he advance. That edge frequently turns into a chance of winning above seventy percent in a best-of-seven series.
And that’s exactly what makes long playoff series work for the favorite and short ones is so much about shock value for the underdog. The table above shows how the opportunity for upsets is drasticly diminished with increasing series length; mathematically it has no choice but to diminish the influence of one hot hand or bad luck.
Color choice, map picks, and other side advantages serves as Elo adjustments, not bonuses. Having the first pick is worth adding twenty points to your opponent’s effective rating. This models this edge in a realistic way by keeping it within one currency that the engine understand naturaly. It combines the two together so you don’t have to guess how much an advantage is worth.
The tool does that for you by combining them into one effective difference. That simplifies things and make it harder to double-count by crediting the favorite with both their skill and their structural benefits twice. But to understand those odds, we must stop thinking of ratings as static characteristics and start thinking of them as ever-changing variables.
The most skilled analysts recognizes that historical variances, format, and context all influence their outlooks. A narrow margin might expand greatly with the proper set-up. And that’s why it isn’t about reaching final conclusions using the calculator (there is no such thing in the realm of competitive gaming). Rather, it’s about understanding your own risks accurately enough to reach informed choices while money is at stake.
The numbers will never guarantee a win; they only show how lopsided the board is before the first shot are fired.