🖥 GPU Fill Rate Calculator
Estimate pixel fill rate from ROPs, texture fill rate from TMUs, rendered pixel demand from resolution and refresh rate, and the bottleneck margin left for overdraw, AA, post-processing, and game effects.
Resolution times refresh before render scale, overdraw, AA, or extra passes.
Uses the efficiency-adjusted ROP estimate against the modeled pixel workload.
Compares TMU throughput against estimated texture samples per rendered pixel.
This setup has wide fill-rate headroom in the current model.
| Preset | ROPs | TMUs | Clock | Pixel fill | Texture fill |
|---|---|---|---|---|---|
| RTX 4090 | 176 | 512 | 2520 MHz | 443.5 GPixel/s | 1290.2 GTexel/s |
| RTX 4080 Super | 112 | 320 | 2550 MHz | 285.6 GPixel/s | 816.0 GTexel/s |
| RTX 4070 Super | 80 | 224 | 2475 MHz | 198.0 GPixel/s | 554.4 GTexel/s |
| RX 7900 XTX | 192 | 384 | 2500 MHz | 480.0 GPixel/s | 960.0 GTexel/s |
| RX 7800 XT | 96 | 240 | 2430 MHz | 233.3 GPixel/s | 583.2 GTexel/s |
| Arc A770 | 128 | 256 | 2100 MHz | 268.8 GPixel/s | 537.6 GTexel/s |
Preset values are practical planning assumptions. Board BIOS, boost behavior, drivers, and game engines can shift real throughput.
| Mode | Pixels | 60 Hz | 144 Hz | 240 Hz |
|---|---|---|---|---|
| 1920 x 1080 | 2.07 MP | 0.12 Gpix/s | 0.30 Gpix/s | 0.50 Gpix/s |
| 2560 x 1440 | 3.69 MP | 0.22 Gpix/s | 0.53 Gpix/s | 0.88 Gpix/s |
| 3440 x 1440 | 4.95 MP | 0.30 Gpix/s | 0.71 Gpix/s | 1.19 Gpix/s |
| 3840 x 2160 | 8.29 MP | 0.50 Gpix/s | 1.19 Gpix/s | 1.99 Gpix/s |
| 7680 x 4320 | 33.18 MP | 1.99 Gpix/s | 4.78 Gpix/s | 7.96 Gpix/s |
This is only active scanout. Render scale, overdraw, AA, blending, and post-processing can multiply it.
| Feature | Typical multiplier | Why it matters |
|---|---|---|
| Render scale 150% | 2.25x pixels | Pixel area scales by width and height. |
| Average overdraw 2.0 | 2.0x writes | Particles, foliage, transparencies, UI, and passes stack up. |
| 4x MSAA | up to 4.0x samples | Edges and depth/color samples can raise ROP pressure. |
| 16x anisotropic textures | more texels | Texture filtering can push TMU demand more than pixel demand. |
| Deferred or post stack | 1.2x to 3.0x | G-buffers, bloom, TAA, SSR, and upscalers add passes. |
| Lowest margin | Reading | Action |
|---|---|---|
| 100%+ | Very comfortable | Fill rate is unlikely to be the main limiter. |
| 30% to 100% | Healthy headroom | Good target for variable scenes and driver overhead. |
| 10% to 30% | Tight | Watch heavy transparency, MSAA, supersampling, and high refresh. |
| 0% to 10% | At risk | Reduce scale, AA, particle density, or refresh target. |
| Below 0% | Modeled bottleneck | The fill-rate model predicts demand above usable capacity. |
When you get a shiny new graphics card with promises of silky-smooth frame rates, it stutters in today’s games even though your CPU is sitting there idling away. That kind of frustration are the result of not understanding where a GPU’s bottlenecks lie. Folks tend to think about core count and memory bandwidth while overlooking something called fill rate. It’s an old metric, right? Wrong. Fill rate isn’t dead. It’s a hard limit based off physics, which will cap performance at higher refresh rates and resolutions no matter how fast your shaders is running. Knowing this can help you tune accordingly when you’re experiencing low frames.
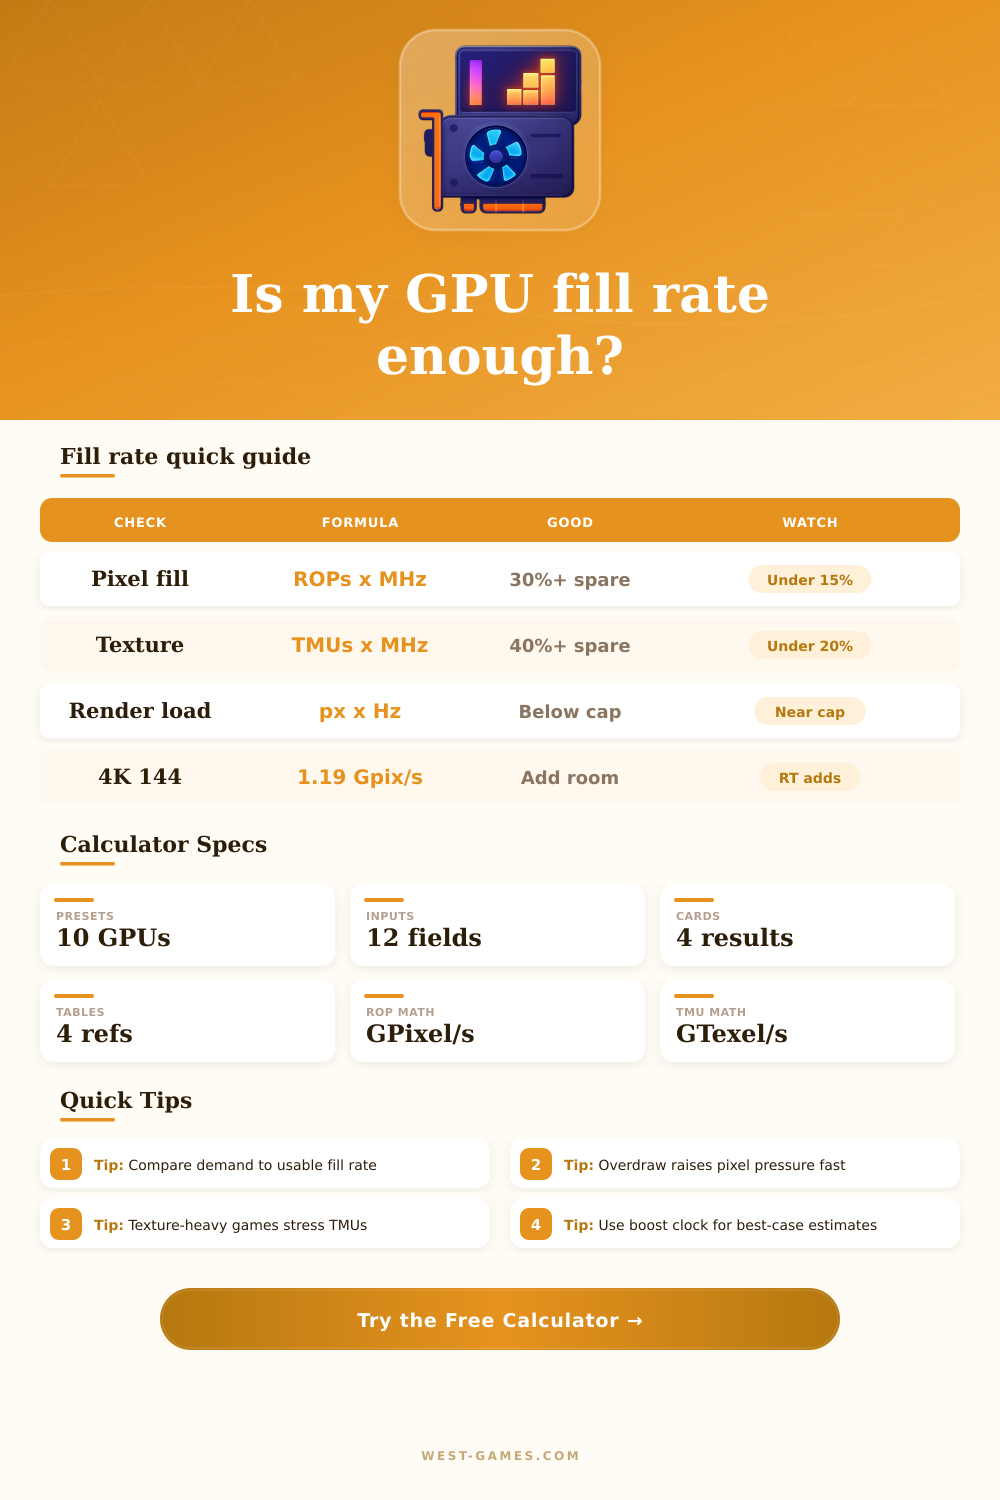
Pixel fill rate is clock speed multiplied by render output units. Likewise, texture fill rate is clock speed times texture mapping units. These are maximums, how many colors can be written to the screen and how many textures can be sampled from memory in one second. If you input your own architecture specs into the calculator above, it do all this math for you and spares you from having to track gigapixels per second. It converts the raw specs into something useful which shows how much your GPU might struggle to keep up with today’s engines.
Why Fill Rate Matters for Your GPU
These multipliers, which boost demand, get ignored by most gamers. “You look at 1440p and it’s a grid of pixels, what’s the big deal?” Yet few games draws just one pass per frame. Many games write multiple times into same pixel area because they have transparency, such as glass or foliage. That’s called overdraw. Your average may be two layer of overdraw. That’s double the pixel pressure on your render output units. Then anti-aliasing adds to the strain. Multi-sample anti-aliasing can quadruple or octuple the sampling load (depending on the setting). Switch from temporal AA to heavy multisampling and your card that worked fine with temporal AA could of choke. The tool has reference tables showing how layer counts and render scale move the bottleneck.
Finally, there’s the added complication of texture sampling which tends to be overlooked. Today’s materials are insanely complex. They don’t just sample one or two textures but multiple ones like normal maps, specular highlights, ambient occlusion, and roughness maps, all in the same pass. When combined with high-resolution anisotropic filtering, the number of texture samples per pixel called for by a shader can skyrocket, demanding far more from your texture units. While different than pixel fill pressure, it’s also restrictive. Perhaps your GPU has ample space to draw pixels but lacks the bandwidth to fetch the corresponding texels. The margin calculation includes this too. It checks your TMU throughput versus the expected number of samples per pixel to provide its own health check on texture bandwidth.
Finally, there’s the efficiency slider in the tool. Because reality isn’t theoretical, there are scheduling overheads, memory latency, cache misses, etc., no GPU run at its theoretical max. For a realistic view, you should set efficiency to around 80 percent. Adjusting it to reflect about 80 percent of theoretical max provides a more realistic representation of what you can use from your GPU instead of some best case scenario number churned out by marketers. It’s important so you don’t get surprised by a bottleneck. If your calculation puts you on the edge even with conservative efficiency assumptions, then you’ll know that turning off some heavy effect or reducing your resolution will make a noticeable difference.
In practice, fill rate is basically a budget. Each frame has a certain number of pixels and textures it can push out, and those visual things consumes this at an alarming rate. Technologies such as DLSS help extend this budget by lowering the resolution internally before scaling it back up to its final size. However, this doesn’t alter the underlying physics. Once you get a feel for where your particular GPU lies on the spectrum, you’ll stop guessing about performance fluctuations and begin to make educated trade-offs. This isn’t about waiting on technology to play catch-up to expectation; it’s about spending your fill rate wisely.