♟ Elo Performance Rating Calculator
Estimate score percentage, FIDE-style performance rating, tournament result, expected score, and rating movement from an event record.
| Score | Rating diff | Meaning |
|---|---|---|
| 25% | -191 | Well below the field |
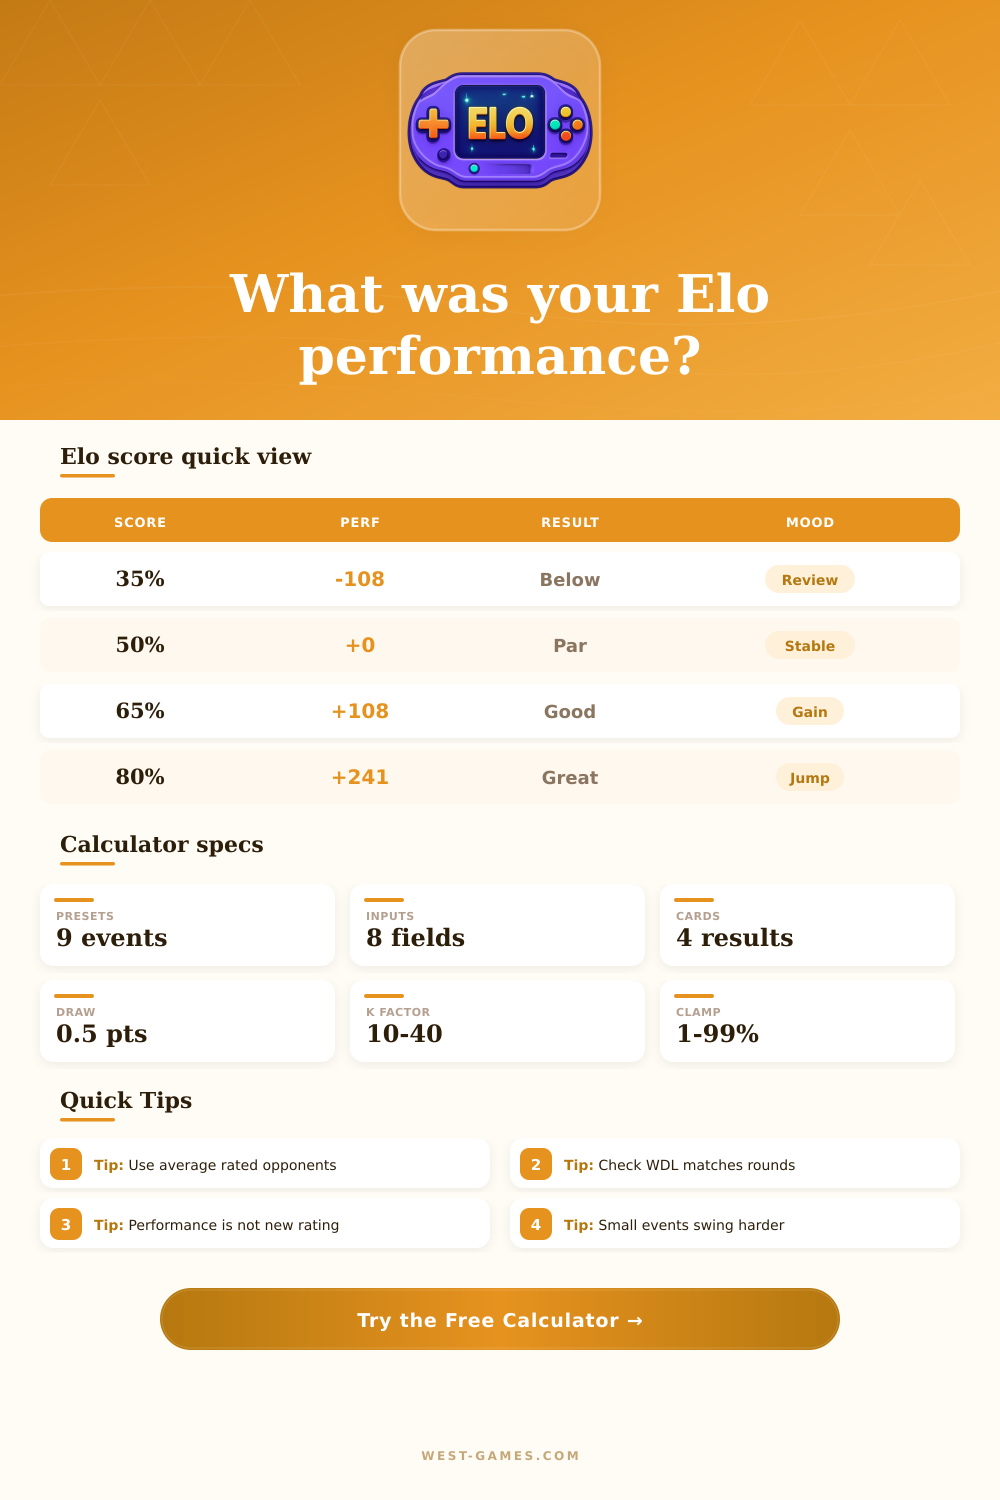
| 35% | -108 | Under par but competitive |
| 50% | 0 | Equal to average opposition |
| 65% | +108 | Clear plus performance |
| 75% | +191 | Excellent tournament |
| 90% | +382 | Dominant event score |
The calculator uses a continuous Elo formula and clamps perfect scores to keep the approximation finite.
| Player gap | Expected | Event read |
|---|---|---|
| -200 | 24% | Underdog field |
| -100 | 36% | Tough pairing set |
| 0 | 50% | Even opposition |
| +100 | 64% | Favorite pressure |
| +200 | 76% | Must score heavily |
Expected percentage uses 1 / (1 + 10 ^ ((opponent rating - player rating) / 400)).
| K | Typical use | One extra point |
|---|---|---|
| 10 | Established master | +10 rating points |
| 15 | Conservative pool | +15 rating points |
| 20 | Established adult | +20 rating points |
| 30 | Developing player | +30 rating points |
| 40 | New or junior rating | +40 rating points |
Official rating bodies may also apply floors, provisional rules, unrated opponent handling, or event-specific limits.
| Actual vs expected | Label | Interpretation |
|---|---|---|
| -1.5 or worse | Heavy loss | Event result landed far below projection |
| -0.5 to -1.49 | Rating slip | Some rating loss likely |
| -0.49 to +0.49 | Stable event | Result near expected score |
| +0.5 to +1.49 | Strong gain | Outperformed field expectation |
| +1.5 or better | Breakout | Major overperformance for the field |
Use the label with the game count: a one-game swing matters more in short events.
| Preset | Field | Record | Use case |
|---|---|---|---|
| Club Swiss Breakout | 1860 average | 4-2-1 | Strong local event against a higher field |
| Weekend Open Even Field | 1600 average | 2-3-1 | Solid plus result in a balanced section |
| Expert Section Push | 2050 average | 3-2-2 | Testing whether a class player performed up |
| Master Norm Chase | 2380 average | 4-3-2 | Long event with high-rated opposition |
| Junior Fast Climb | 1320 average | 5-1-1 | Large K-factor growth scenario |
| Online Rapid Arena | 1725 average | 8-4-3 | Fast time-control volatility check |
| Round Robin Grind | 1910 average | 2-5-2 | Many draws against similar ratings |
| Upset Heavy Run | 2150 average | 3-1-2 | Lower-rated player beating a strong field |
| Title Event Survival | 2520 average | 1-4-4 | Survival result in a much stronger pool |
A performance rating is a mathematical calculation that determine a specific number to denote how a person played in the tournament they participated in. Many people is often not sure how to understand their tournament results, but providing a performance rating for each tournament help to remove that uncertainty from the outcome of their tournaments. A performance rating can show how a person performed in relation to the strength of there opponents.
A performance rating is calculated more different than the rating change for a player. The rating change for a player can often be misleading. For instance, a person might have a small change in their rating, but they performed exceptional well against high-rated opponents.
What Is a Performance Rating
The performance rating will account for this by showing the percentage of the players games won compared to the expected percentage of games won by a player of that rating. Performance ratings can show if a player performed at a higher level than their current rating suggest. There is several specific elements that must be calculated in order to determine a performance rating.
The average of the opponent ratings is the first calculation. This is provided to show the percentage of games won by the player in relation to the strength of their opponents. The number of games played is the second calculation.
This is used to determine the fluctuation in a player’s performance ratings. The pre-event rating for the player is the third calculation. This is used to calculate the expected number of games that the player will win during the tournament.
The performance rating can then be used to compare the players actual performance to the expected performance. Another specific element to calculating the performance rating is the K-factor. The K-factor indicate the change in a player’s performance rating due to their games played.
The higher the K-factor, the more higher the change in the player’s performance rating. The calculation of the performance rating uses the same element as the Elo rating system with a performance adjustment to the player. There are many different mistake that can be made with performance ratings.
One of the most common is to treat the performance rating as if it is the player’s permanent performance rating. A performance rating is not a permanent performance rating. It indicate only the player’s performance within that one specific tournament.
For instance, if a player achieve a performance rating of 2100, but their average opponent rating was 1900, it does not mean that they are now a player with a 2100 performance rating. All it means is that the player performed in their tournament as if they were a player with a 2100 performance rating. There are also reference tables for performance ratings.
For instance, a score of 65 percent in a tournament might reveal a performance rating of 108 points above the player’s opponent average. A score that is very close to the expected score indicate that the player had a stable performance during the tournament. There are also complications to consider in some tournaments.
For example, games with byes, opponents of the same rating, and shifting average opponent ratings can all impact the calculation of the players performance rating. To account for this, players can calculate their performance rating both with and without these specific game to reveal any changes to their performance rating caused by those specific games. A performance rating for a single tournament will not reveal the accomplishment of a player.
However, a series of performance ratings will reveal the improvements of a player. If a player has performance ratings that are higher than their current performance rating for a number of tournaments, then their current performance rating is likely too low. If their performance ratings is the same as their expected performance rating, then their current performance rating is likely accurate.
The performance rating system reveal these differences so that players understand the goal that they can set for their future tournaments.