⚡ Power Limit Percentage Calculator
Convert GPU or CPU stock power into a new percentage limit, then estimate watt cap, voltage and frequency offset impact, expected clock, temperature change, and efficiency shift.
Your selected percentage and offset stack.
Baseline without power limit changes.
Common quiet gaming target.
Shows heat cost of extra headroom.
| Setting | Typical watt cap | Clock behavior | Best use |
|---|---|---|---|
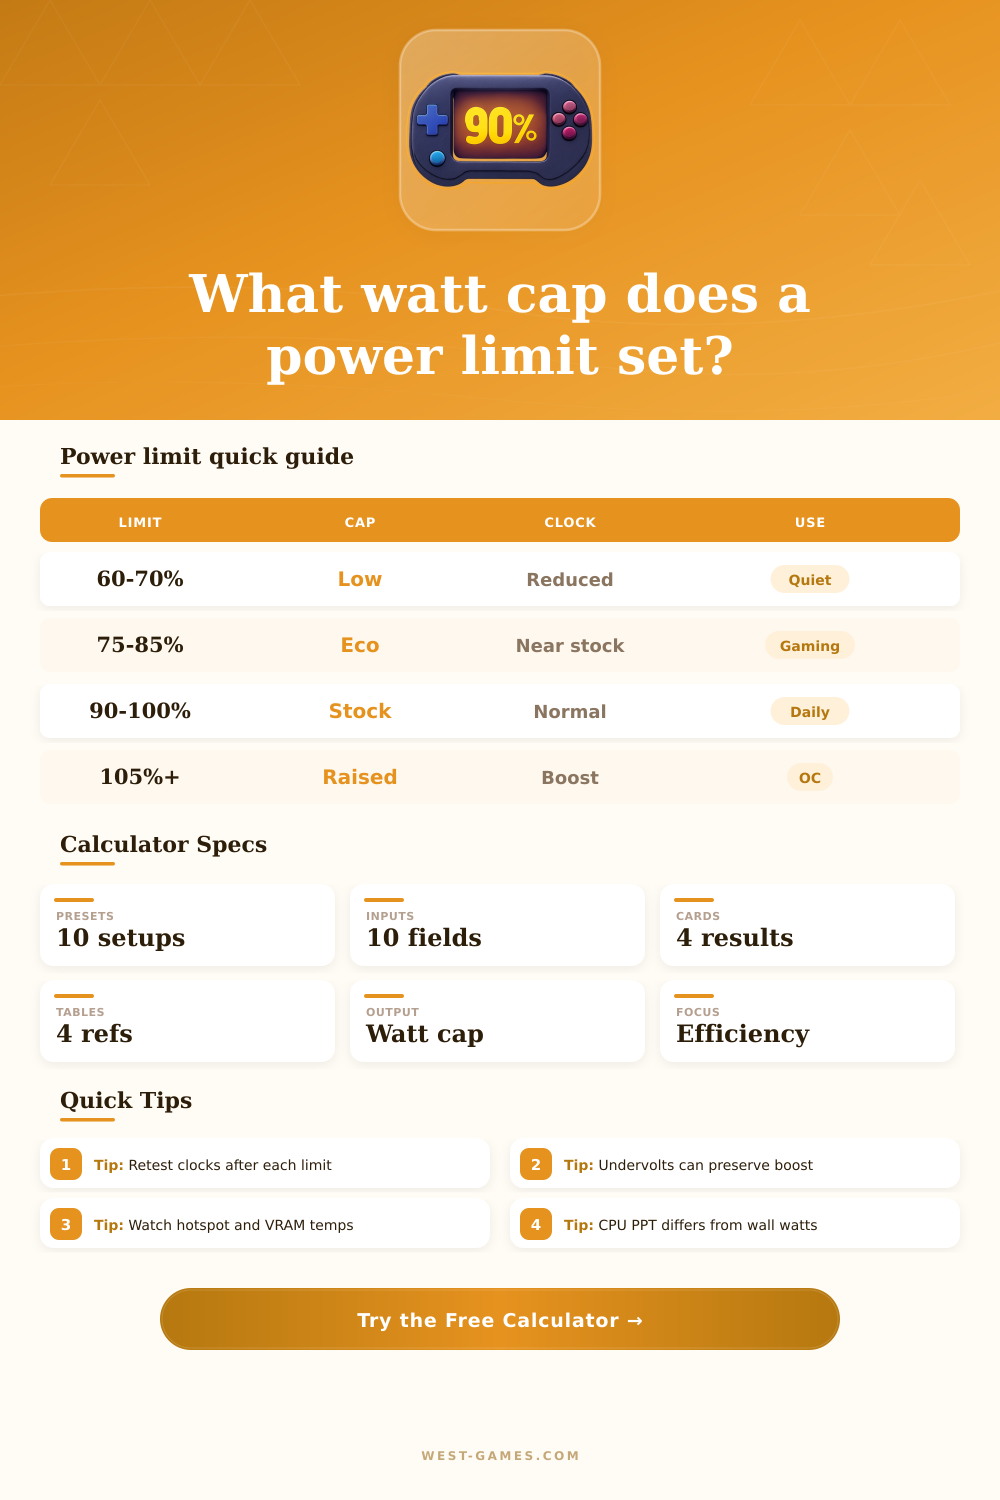
| 60 to 70% | Strong reduction | Often below max boost | Silent or small case gaming |
| 75 to 85% | Eco range | Near-stock on efficient GPUs | High efficiency gaming |
| 90 to 100% | Default range | Normal boost behavior | General use and benchmarking |
| 105 to 115% | Raised board power | Small gains if thermal headroom exists | Manual overclock testing |
GPU sliders usually scale board power, so memory, fans, VRM, and core draw share the cap.
| CPU term | Meaning | Calculator field | Practical note |
|---|---|---|---|
| PPT | Package power tracking | Stock power limit | Common on Ryzen tuning tools |
| PL1 | Sustained power | Stock or new cap | Useful for long renders |
| PL2 | Short boost power | Raised limit scenario | May only apply for turbo windows |
| Eco Mode | Lower PPT target | New percentage | Often preserves gaming speed |
CPU wall power is not the same as package power; use sensor-reported package watts when possible.
| Offset mix | Power effect | Clock effect | Risk check |
|---|---|---|---|
| -50 to -100 mV | Lower demand | Can hold higher boost | Test game and stress stability |
| -150 mV or more | Large reduction | Great if stable | Watch crashes or driver resets |
| +50 MHz | Small demand rise | Modest boost gain | Check for power clipping |
| +150 MHz or more | Higher demand | Needs voltage and cooling | May erase efficiency gains |
Offsets are estimates because every GPU or CPU voltage-frequency curve bins differently.
| Power drop | Expected temp drop | Clock loss | Efficiency result |
|---|---|---|---|
| 5 to 10% | Small but noticeable | Usually tiny | Good daily tune |
| 15 to 25% | Major improvement | Low to moderate | Often best sweet spot |
| 30 to 40% | Very large | Visible in heavy loads | Quiet-first profile |
| Raised above stock | Warmer | Small gains only | Efficiency usually falls |
Temperature change depends on cooler strength, fan profile, ambient temperature, and hotspot transfer quality.
| Preset | Stock watts | New limit | Expected outcome |
|---|---|---|---|
| RTX 4060 quiet gaming | 115 W | 70% | Very low heat with small clock loss |
| RTX 4070 balanced | 200 W | 80% | Near-stock gaming with better efficiency |
| RTX 4090 high-end eco | 450 W | 70% | Large watt drop with strong retained boost |
| Ryzen 5 Eco PPT | 88 W | 74% | Cooler all-core loads and steady gaming |
| Core i7 PL1 tune | 181 W | 78% | Lower sustained temperature in renders |
Treat the table as a tuning map, then verify with your own power telemetry and clocks.
When you bought that fancy new processor or graphics card, I’m willing to bet that it was because you wanted more computing power and you want it faster; not slower. But running hotter make the fans spin and makes the temperature skyrocket. Running hot enough can cause your computer to throttle itself back when playing games to avoid overheating. That results in lower frame while gaming hard.
This calculator will tell you what percentage of its power that you can throttle down without seeing any noticeable hit to performance. So instead of guessing, it’s a straightforward math exercise. Diminishing returns are the idea behind all this. Up to some point, moddern chips are efficient: increase the power and they will boost clock speeds by a certain amount. But beyond that point, each additional watt of power only gets them so many more megahertz.
How to Lower Power Without Losing Speed
Picture it in terms of a bathtub. If the tub is empty, adding the first gallon help fill it a lot. The final drop almost doesn’t move the water up an inch because the tap is running right into the drain. Sliding the power limit downward is sort of like turning down the tap a bit. For a chip that has been pushing up against its thermal ceiling, that little adjustment lets the processor continue running at high clocks for slightly longer. And voila! No more throttling. That’s the sweet spot most tuner aim for.
In the tool, you’ll find options to adjust frequency and set voltage offsets. Why? Because when it comes to power consumption, more isn’t always better. Turning down your voltage by even a hair can cause a dramatic decrease in heat output while keeping your frame rate intact. That’s where the cooling strength and baseline temperature questions come into play. A beefy liquid cooler behaves different than a small air cooler. Great airflow might mean you won’t have to reduce power as heavily since the heat can be released naturaly. Limited airflow (like if you’re rocking a compact case) means you’ll probably notice larger gains from capping off that wattage at eighty percent instead of ninety-five.
Not every workload behave the same way with these changes. If you’re running a physics simulation or doing some heavy-core rendering, that sort of thing can be strictly limited by power limits. Cutting the limit back from 100 percent to seventy-five percent will immediately slow down your processing speed in those instances because the app require continuous high current draws. For gaming, things tend to be more forgiving. Most games aren’t bottlenecked by raw core power; instead they’re bottlenecked by driver overhead or GPU memory bandwidth. This is why the tool has a sensitivity selector to change its behavior based off your workload type. The tool assumes that a casual gamer should have different settings then a video editor.
If you look at the page’s reference tables showing typical behavior for different percentage ranges, you will see something interesting. Even in today’s architecture, using an undervolt for example, going down to sixty or seventy percent results in surprisingly little performance drop. Less heat equals lower fan speeds and that’s where the real savings come into play. Quiet gaming sounds good and increases component life span. It also creates a far more pleasant gaming environment when you’re on a video chat, taking a phone call, or just want to hear someone talking in a movie.
Unless you’re doing a professional benchmark suite, don’t get caught up on a single digit difference in frame rates. If it’s smooth with no stutter, it’s hard for our eyes to differentiate between 55 frames per second versus 60. Almost always we would of take a cooler, silent system with steady temperatures over a system that gets two extra percent performance at the expense of heat and noise.
Test it, use the tool as a sign to see what your lowest power setting feels like while still remaining responsive to you. Next, check these numbers within the tools you’ll actualy be using. Real-world stability tests will tell you if your specific silicon sample can hold the line or if it needs a bit more breathing room. Do you need just a little more breathing room, or did your specific silicon sample cut the mustard? Find balance. We want this thing running hard enough to do the job, but cool enough that we forget about it.