⚡ Total System Latency Calculator
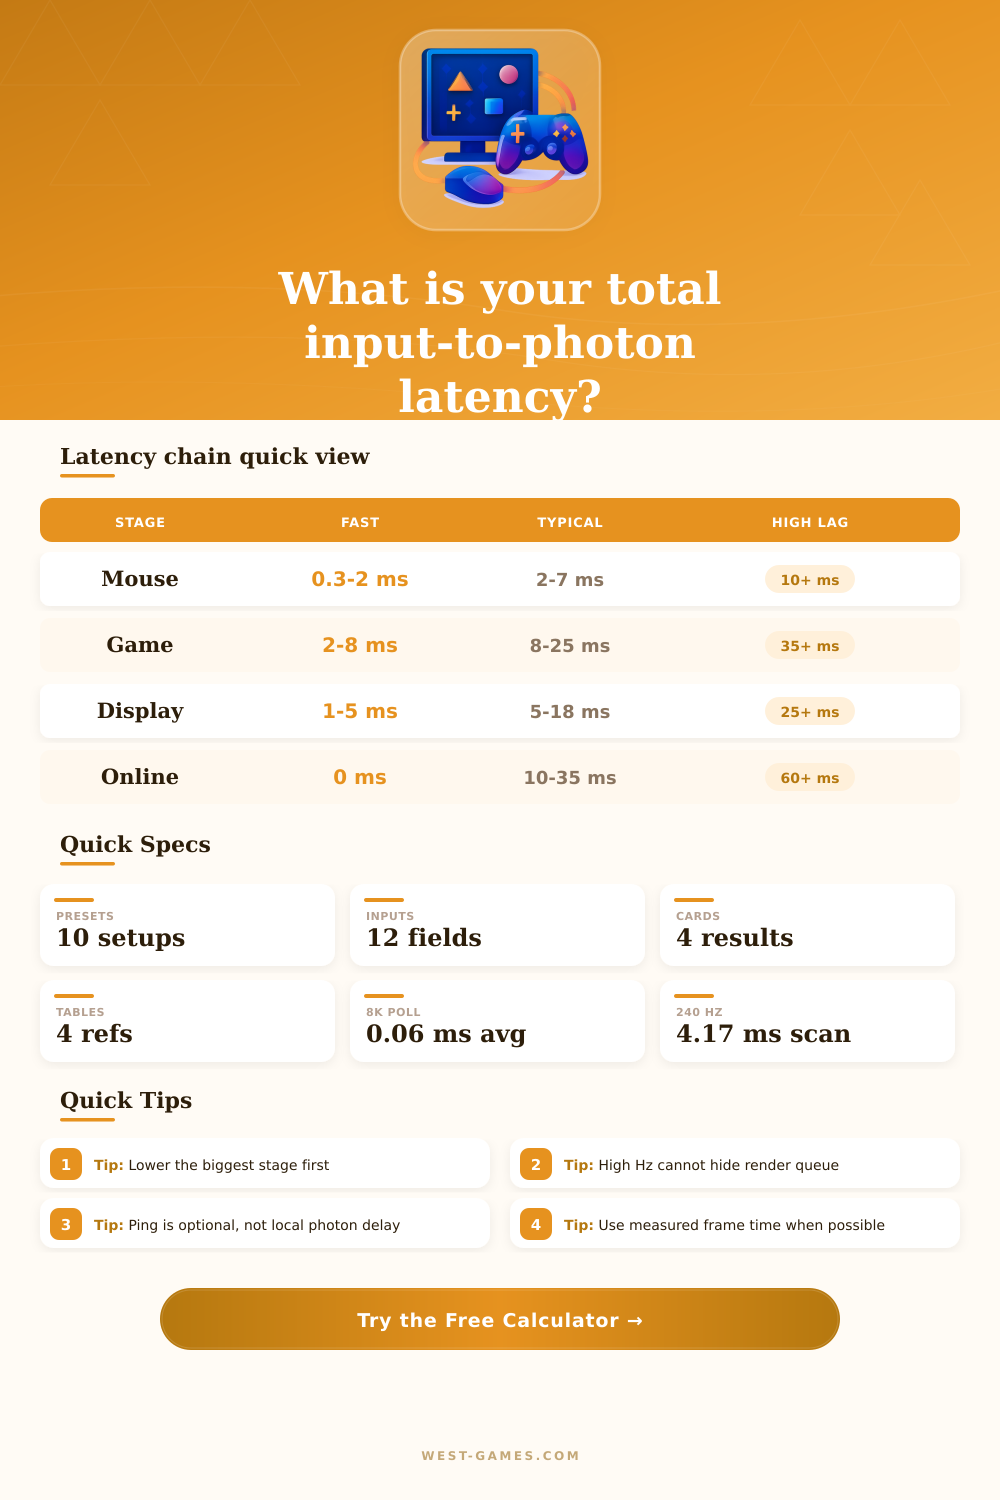
Estimate total input-to-photon latency from mouse scan, debounce, USB polling, game queue, render time, display scanout, pixel response, and optional online ping.
Your selected local input-to-photon path.
Shows whether very high polling is doing visible work in this full chain.
Compares your render path against a common normal game-loop queue.
Shows how much a low-refresh scanout can dominate a responsive device.
| Component | Fast range | What changes it |
|---|---|---|
| Mouse scan | 0.06-4 ms avg | Internal scan rate, sensor timing, switch scan policy. |
| Debounce | 0-8 ms | Optical switches, firmware filters, mechanical chatter margin. |
| USB polling | 0.06-4 ms avg | 125, 500, 1000, 4000, or 8000 Hz polling. |
| Transport | 0.1-15 ms | Wired USB, 2.4 GHz wireless, Bluetooth, hub, TV controller path. |
| Stage | Typical delay | Notes |
|---|---|---|
| Input sample to game frame | 0.2-1.5 frames | Low latency modes reduce the queue before rendering starts. |
| Render time | 2-33 ms | Depends on FPS, GPU load, CPU bottlenecks, and graphics settings. |
| Sync wait | 0-2 frames | VSync, triple buffering, and frame caps can add or remove wait. |
| Frame pacing spikes | Varies | 1% lows often feel worse than the average latency number. |
| Refresh | Full scanout | Average position | Pixel note |
|---|---|---|---|
| 60 Hz | 16.67 ms | 8.33 ms | TV processing can exceed pixel response. |
| 120 Hz | 8.33 ms | 4.17 ms | Common console performance target. |
| 240 Hz | 4.17 ms | 2.08 ms | OLED transitions are often very low. |
| 360 Hz | 2.78 ms | 1.39 ms | Useful only when render and queue are also low. |
| Network case | Calculator mode | Added estimate |
|---|---|---|
| Local aim feel | Exclude network | 0 ms added to input-to-photon. |
| Online server response | Half ping + half tick | Approximates one-way trip plus average server tick wait. |
| Cloud gaming | Full stream round trip | Uses RTT plus server tick wait as a broad streaming feel estimate. |
| High jitter | Manual buffer | Add extra ms in render or transport if the stream buffers. |
“Look there’s my enemy on the screen,” you say. “But my character hasn’t turned around yet.” Lag is caused by more than just lag. There’s a physical chain from your finger to photons being emitted, passing through software queues and electronics along the way. Most gamers focuses on one number in the pipeline and ignore all the others.
The total system latency calculator maps out that entire journey from your finger to photon. That’s where the myth begins: with the input device. Four or eight thousand hertz polling rates sounds great on paper. That means less waiting between when your mouse sends its signal and your computer recieve it. Except, the fraction of a millisecond you shave off the USB transport doesn’t matter if it’s less than the fifteen milliseconds it takes your display to refresh. Reducing that by half won’t make much difference in-game.
How to Fix Lag in Games
Usually, that’s your engine. That’s where all of those frame queue up before they even reach the graphics card. Triple buffering and Vsync can tack on one or two whole frames of delay. One frame at 60hz is sixteen milliseconds. Three-hundred and sixty hertz? It is under eight. If you’re queuing multiple frames or rendering for longer than a few milliseconds, you’ll start to notice it in your latency. And with that, the calculator breaks it down for you, letting you know whether your queue size or render time dominates the overall process. To get any real results, lower largest stage first.
There’s one more piece of complexity that most users don’t think about, display technology. When you look at a monitor, it doesn’t show the entire image all at once. Instead, it scans out row-by-row (from top to bottom). So something near the top of screen will appear earlier than something near the bottom. That’s what we mean when we say scanout position make a difference in exact measurement. To account for it, the tool enables you to specify the area on the virtual panel where you’re trying to hit. A little thing, sure, but it helps explain why some shots seem crisp and others seems to come in late.
That’s also where things like pixel response time come into play. OLED displays change color almost immediately. LCD displays has to work to switch from one shade to another. That lag isn’t noticeable for most when watching TV or videos casually. When you’re playing competitively and everything adds up, it can be the difference than milliseconds. The page has a few reference tables detailing how various panel types compare to one another. It’ll help explain why you could pick up a $600 monitor that feels slower then a cheaper OLED if configured incorrectly.
Finally, let’s talk about network latency. Local hardware delay isn’t the same thing. Because the signal stays in the room, your mouse feel instant. Online games adds a round trip time as the server receives your action, processes it, and sends it back to you. The calculator adds this separately so you do not confuse local responsiveness with server lag. High ping could mean you have a zippy mouse but still feel sluggish. Separating these two metrics help avoid frustration when debugging performance problems.
To put those numbers into context, there are presets built into the tool. Because an esports PC can push three-hundred and sixty frames, it’s going to have less inherent base delay than a console operating at sixty hertz. It is not because of a fault in the console. It is not because of a problem with a game engine. It is because of a tradeoff in power efficiency or graphical fidelity. Knowing where you fall on that spectrum means setting realistic expectations. There is no way around physics.
At the end of the day, pursuing lower numbers makes sense when you can tell that they’re different. While our brains are excellent at visual processing (and even have a very high rate of success), there’s a limit. After your local system latency falls under 10 milliseconds, improvements shouldn’t of matter for nearly everyone. You want to find that sweet spot between performance, cost, and tangible competitive gain. Measure what matters. Ignore the rest. Your reaction time will thank you.