RNG Luck Percentile Calculator
Compare your actual drops against the expected drop rate, then estimate percentile rank, p-value, luck band, dry streak rarity, and a confidence range for the same number of attempts.
Model note: This calculator treats attempts as independent Bernoulli rolls after rate boosts. If a pity value is entered, the expected rate is adjusted to reflect guaranteed success by that attempt count.
Probability Breakdown
Dry Streak Comparison
Your log
Your observed drop rate is being compared to the listed RNG chance.
Average player
Expected value is the long-run mean, not a promise for one session.
Lucky threshold
This is around the top 10% result for the same attempts.
Dry threshold
This is around the bottom 10% result for the same attempts.
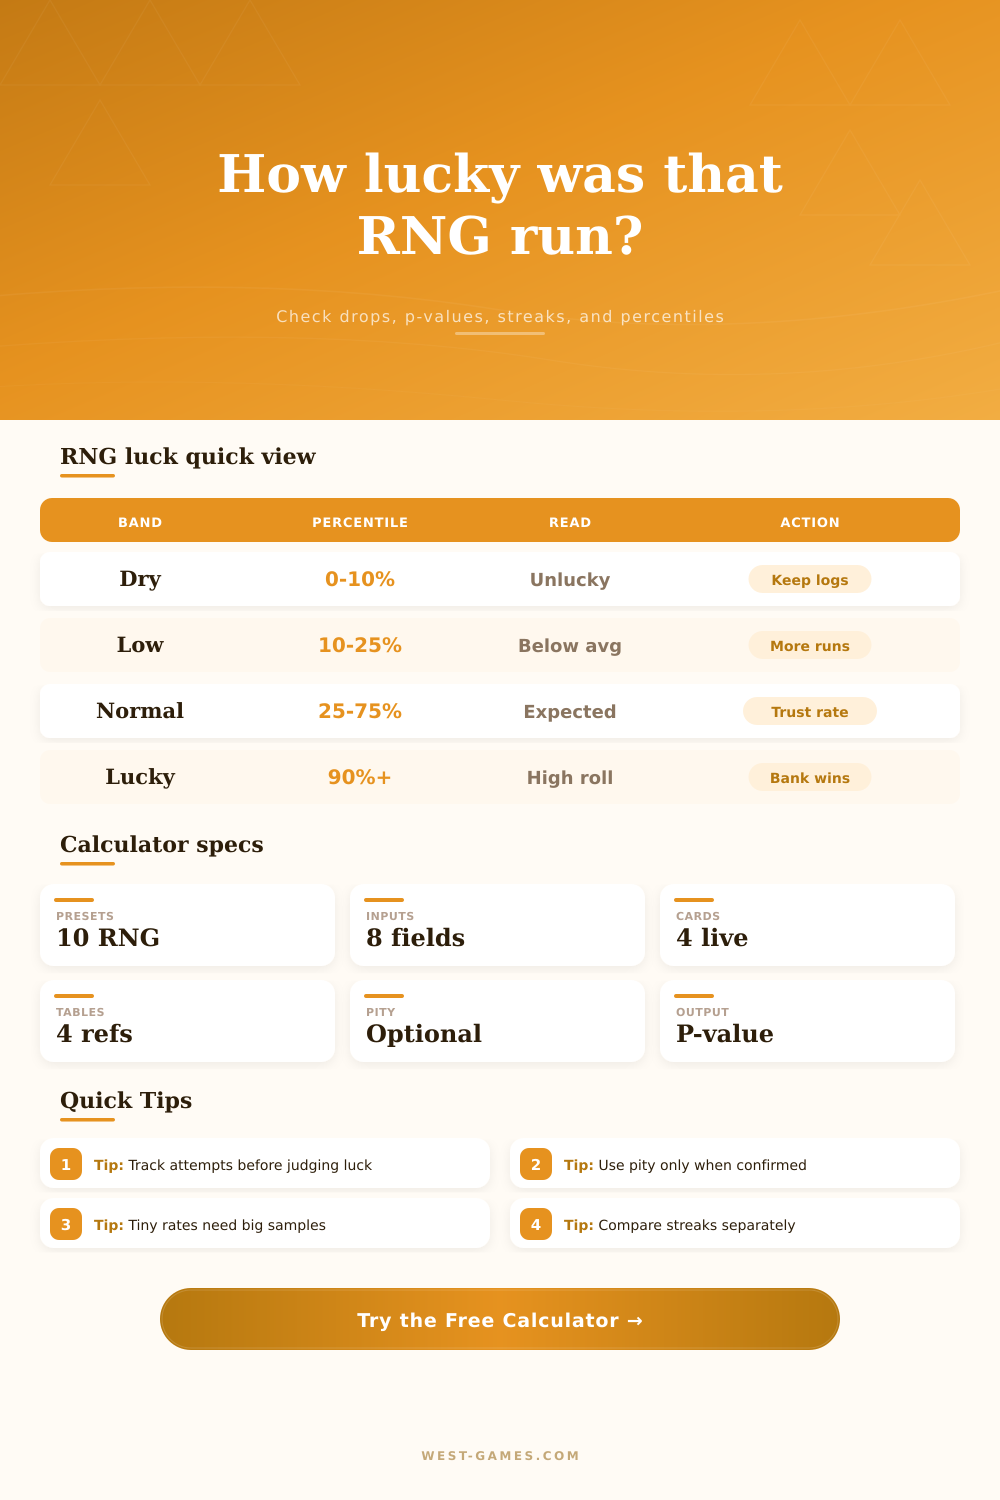
| Percentile | Band | Meaning |
|---|---|---|
| 0-5% | Extremely unlucky | Very low drop count for the sample size. |
| 5-25% | Unlucky | Below expected, but still common in RNG systems. |
| 25-75% | Normal range | Close enough to expectation for most farms. |
| 75-95% | Lucky | Above average drop count for this sample. |
| 95-100% | Extremely lucky | Rare high roll compared with typical players. |
| P-value | Read | Practical take |
|---|---|---|
| 0.20+ | Normal | The result is not unusual for the stated rate. |
| 0.05-0.20 | Noticeable | The run is lucky or unlucky, but plausible. |
| 0.01-0.05 | Rare | Worth double-checking rate boosts and logs. |
| Under 0.01 | Extreme | Very unusual if the listed rate is correct. |
| Scenario | Typical listed rate | Sample size pain point | What to track |
|---|---|---|---|
| Rare MMO mount | 0.5%-1% | Hundreds of clears | Account-wide attempts and lockouts. |
| Gacha SSR | 0.3%-1% | Pity changes the math | Pull count since last guarantee. |
| Shiny hunt | 0.012%-0.1% | Very long dry streaks | Encounters, charms, chain bonuses. |
| Dungeon blueprint | 5%-10% | Dozens of runs | Eligible boss kills only. |
| Crafting proc | 10%-25% | Variance fades faster | Each craft attempt and material tier. |
| Cosmetic crate | 1%-5% | Boosts can matter | Crate type, event boost, duplicates. |
| Range | Best use | Tradeoff |
|---|---|---|
| 80% | Quick session check | Narrower, less conservative. |
| 90% | Routine farm review | Good balance for gaming logs. |
| 95% | Default luck audit | Conservative without being huge. |
| 99% | Dispute or bug check | Wide range, strongest caution. |
| Single-roll rate | 50 dry odds | 100 dry odds |
|---|---|---|
| 0.5% | 77.83% | 60.58% |
| 1% | 60.50% | 36.60% |
| 2% | 36.42% | 13.26% |
| 5% | 7.69% | 0.59% |
For forty consecutive nights, you’ve beaten this damn raid boss and now you’re desperate for mount with the one percent drop rate on paper. You’re running out of patience. Your inventory contain nothing. Maybe the game is rigged against you? Maybe you’re just on some sort of bad luck streak?
It’s something all gamers feel, it is nearly always statistically normal. It happens because our brains aren’t very good at understanding randomness. If things happen randomly we want them to form patterns even when they don’t. After enough failures, we think the universe owes us a victory, but that simply isn’t how it works.
How to Use a Drop Log Calculator
That’s where a drop log calculator comes in, it takes guesswork out of knowing when to get frustrated by doing math for you. To use calculator above effectively, you need to understand what variance actualy looks like. Input data from your drop log. It will then plot your result on expected distribution and give you a percentile ranking compared to other players in same situation. Are you in the fifth percentile? You’re unlucky. Ninety-fiveth percentile? You’re pretty darn lucky. Somewhere in between? Standard statistical noise; that’s most of the time.
Pity is also very important. A lot of loot systems and gacha games has some sort of guaranteed drop after enough attempts. So if you don’t account for pity, then you’re not accounting for changing probability model. At pity, the events are no longer independent and do not has the same chance. There’s a way to compensate for it on this calculator by including a pity value. Adjusting for that will change your expectation. It will also prevent false alarm of thinking you should of gotten something now that you understand how rules work.
Similarly, many people is still combining boosted and unboosted tries into one entry. You can’t average them together without considering that you had 25% boost for half of those while not having it on the other half. Splitting your logs or doing the conversion yourself (the tool allows you to enter an effective rate) will allow you to do this. Why? This is because boosted runs has a narrower range around the mean. An unboosted run have a much wider range. Blending them together smears things and makes it more difficult to assess how well you did. Clean up your logs. Also, keep separate entries if conditions changed considerably.
The part where most people fail to keep their cool is with dry streaks. That’s why the page has a reference table outlining just how likely long dry runs can be, even at reasonable drop rates. It is not uncommon to have a forty-attempt dry streak at a one percent chance rate. It happens far more frequent than you’d imagine. You’ll remember being on a painful dry streak, but you won’t remember the average streaks that went off quietly without you noticing.
That recency bias clouds your sense of luck but the calculator lets you see the odds of your existing streak compared to what should happen. If it tells you normal, trust it. Walk away from computer. Don’t waste resources attempting to force something that math tells you will come when it wants to come.
The knowledge doesn’t take away the grind. It simply takes away your confusion. Yes, you’re still going to open that crate. And yes, you’re still going to run that dungeon. But when the system is working as intended, you no longer wonder whether or not something is broken. All too often, people mistake bad design for luck. Given the proper numbers, you’ll know the difference between an actual problem and just a dip in the road.
If that’s true when you’re dealing with a wall of failures, then what do we do next time? Check the percentile. See if you’re in normal range. Accept it. The math says you’re fine. It doesn’t lie. And while your gut might feel otherwise, trust the spread… Because its honest and cold.