⚡ Power Draw Per Hour Calculator
Estimate gaming PC wall draw from component watts, real load percentage, idle/load time split, PSU efficiency, monitor draw, kWh per hour, session energy, daily energy, and heat output.
Uses your load split, PSU efficiency, and display watts.
Assumes every active minute stays at gaming load.
Useful for downloads, patching, chat, and desktop time.
Same workload modeled at 94% PSU efficiency.
| Component | Typical gaming range | Notes |
|---|---|---|
| CPU package | 35-220 W | Boost behavior and game engine thread use matter. |
| GPU board | 75-600 W | The largest variable in most gaming systems. |
| Motherboard and RAM | 20-80 W | High-end boards, many DIMMs, and RGB increase draw. |
| Storage and cooling | 8-90 W | HDDs, pumps, many fans, and capture cards add up. |
| Monitor and external gear | 18-250 W | Brightness, HDR, screen size, and multi-monitor setups dominate. |
| Efficiency | What it means | Wall formula |
|---|---|---|
| 82% | Basic or low-load estimate | PC DC W / 0.82 |
| 87% | Common mid-load estimate | PC DC W / 0.87 |
| 90% | Strong gaming-load estimate | PC DC W / 0.90 |
| 94% | Very efficient target | PC DC W / 0.94 |
| 96% | High-end narrow-band estimate | PC DC W / 0.96 |
| Session style | Load split | When to use |
|---|---|---|
| Benchmark loop | 95-100% load | Stress testing, shader tests, repeated game runs. |
| Ranked multiplayer | 75-90% load | Matches with queues, menus, and short breaks. |
| Open-world play | 65-85% load | Map screens, inventory time, and mixed GPU scenes. |
| Downloads and chat | 5-25% load | Launcher updates, desktop apps, video, and voice chat. |
| Idle desktop | 0-10% load | Mostly waiting, syncing, or remote access. |
| Measure | Conversion | Use in this calculator |
|---|---|---|
| Watts to kWh/hour | W / 1000 | Average wall draw becomes kWh per active hour. |
| Session kWh | kWh/hour x hours | Multiplies by the session length input. |
| Daily kWh | Active kWh + standby kWh | Uses active hours and remaining standby hours. |
| Watts to BTU/h | W x 3.412 | Estimates room heat while the setup is active. |
| kWh to BTU | kWh x 3412 | Estimates total heat over a whole session. |
When building out a gaming rig, you go all-out for high-framerates and clear visuals, shelling out big bucks on fancy components. Hours is spent arguing over which graphics card to get, what kind of CPU core counts, and which case has that cool look. And then you plug it in and turn it on without any thought as to what’s going on back there behind that wall outlet. This oversight ends up costing most builders far more than they realize (not just in money (electricity bill)), but also in terms of heat that makes their desk into a sweat-drenched hellhole.
Learning where that power flows in a system change how you run your set-up. When you know the spec on all your components, plugging them into this calculator do the math for you. You won’t have to guess at the conversion factors or coefficients. Separating your draws from the wall and inside the box is initial step. The numbers for your GPU and CPU is their ratings in the DC voltage used inside the box. It doesn’t include the inefficiency of converting household AC electricity into the stable voltage that your silicon require. This is represented by a higher wattage at the breaker and waste heat.
Why You Need a Power Calculator for Your PC
If your power supply is ninety percent efficient, that’s why you have to draw about one-hundred-and-ten watts off the wall for every hundred-watts you want on the board. That might sound like a minor penalty, but if your graphics card alone is drawing three hundred watts while you’re gaming hard, it’ll add up fast. Enter its efficiency percentage here to see actual wall draw instead of just the sum of the components.
When most folks think about turning on their PC, they imagine it running at peak capacity. That’s not true for gaming. A large portion of time spent playing games are spent watching video tutorials or browsing websites. Time is also spent waiting for a match to begin and navigating menus. When that happens, your computer is drawing much less power than when you’re actualy gaming. To account for this, the calculator ask for a percentage split for its load. If you game eighty percent of the time and sit around waiting the rest of the time, your average draw will be much lower then if everything were running at full power all the time.
Why does this matter? It matters for both thermal management and your monthly bills. In the end all that power that goes into the room turns into heat. Electricity doesn’t dissapears, it turns into screen light and room heat. That means if you have a top-of-the-line rig pulling 600 watts out of the wall, it’s dumping an incredible amount of thermal energy in the room every hour. That heat will cause typing to become uncomfortabley far before your hardware begins to throttle if you’re using a small bedroom office with poor airflow.
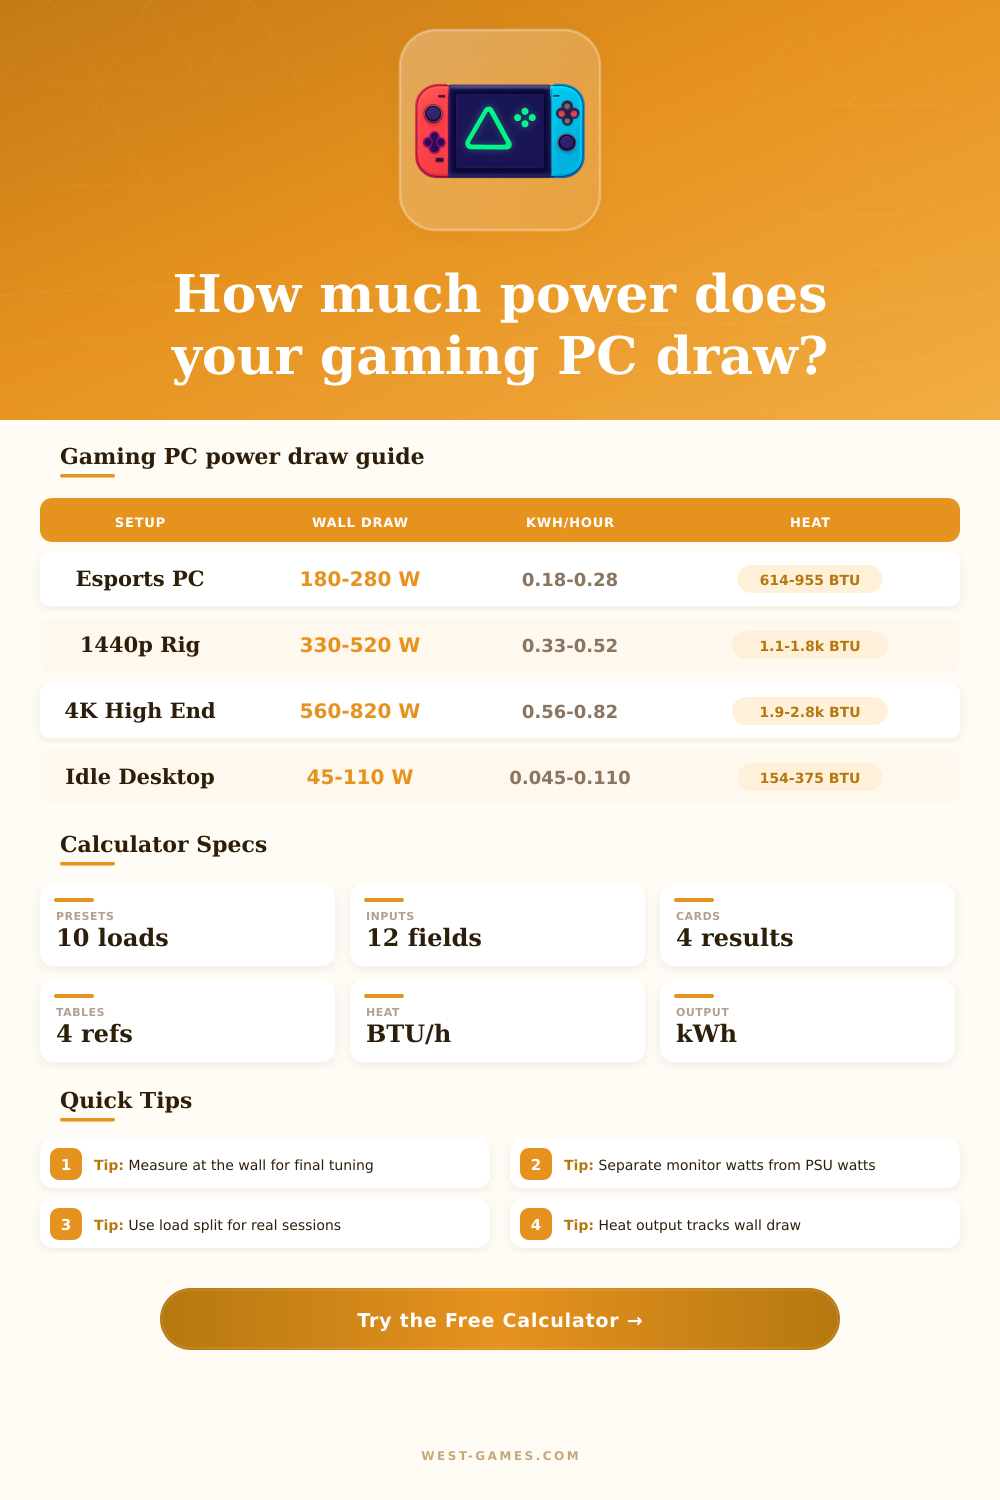
This is expressed in the reference table on the page that breaks down estimated draw ranges for various builds. I think that really puts each component into perspective. That budget esports machine might only be drawing fifty watts in an idle state where a flagship 4K rig may being pulling around eight-hundred. While cost is part of the equation here, so too is how you plan to interact with that computer. If you want something more efficient, you’ll get better efficiency ratings. If you plan on keeping your computer idling all day, then you’ll have to make conscious decisions about your idle setting to lower your overall draw.
But you could of escaped the physics behind energy conversion. Don’t neglect your monitor(s) and peripherals either. Those gets plugged in to the wall individually from your PC case, which makes it easy to forget. A big 4K panel with bright HDR backlighting can suck up as many watts as a mid-range graphics card running lightly loaded. Throw in some LED lighting strips and/or multiple screen and that base number goes way up. Since those draw directly off your home’s overall energy use, the tool has specific fields for them.
And lastly, what about that stand-by draw? How many times have you walked away from your desktop only to leave it in low-power or sleep mode for several hours a day? The energy wasted in those few watts over the course of a twenty-three hour period easily outweighs that huge surge of power while you’re gaming hard at night. Adjusting your power settings so they waste fewer watts while idling is one of the simplest ways to cut back on your annual consumption without any compromise whatsoever once game time rolls around.
It is not because you’ll save pennies on the bill, but because you don’t want your work area warm and noisy when you’re not using it and you want to get the most out of each watt you’re paying for.