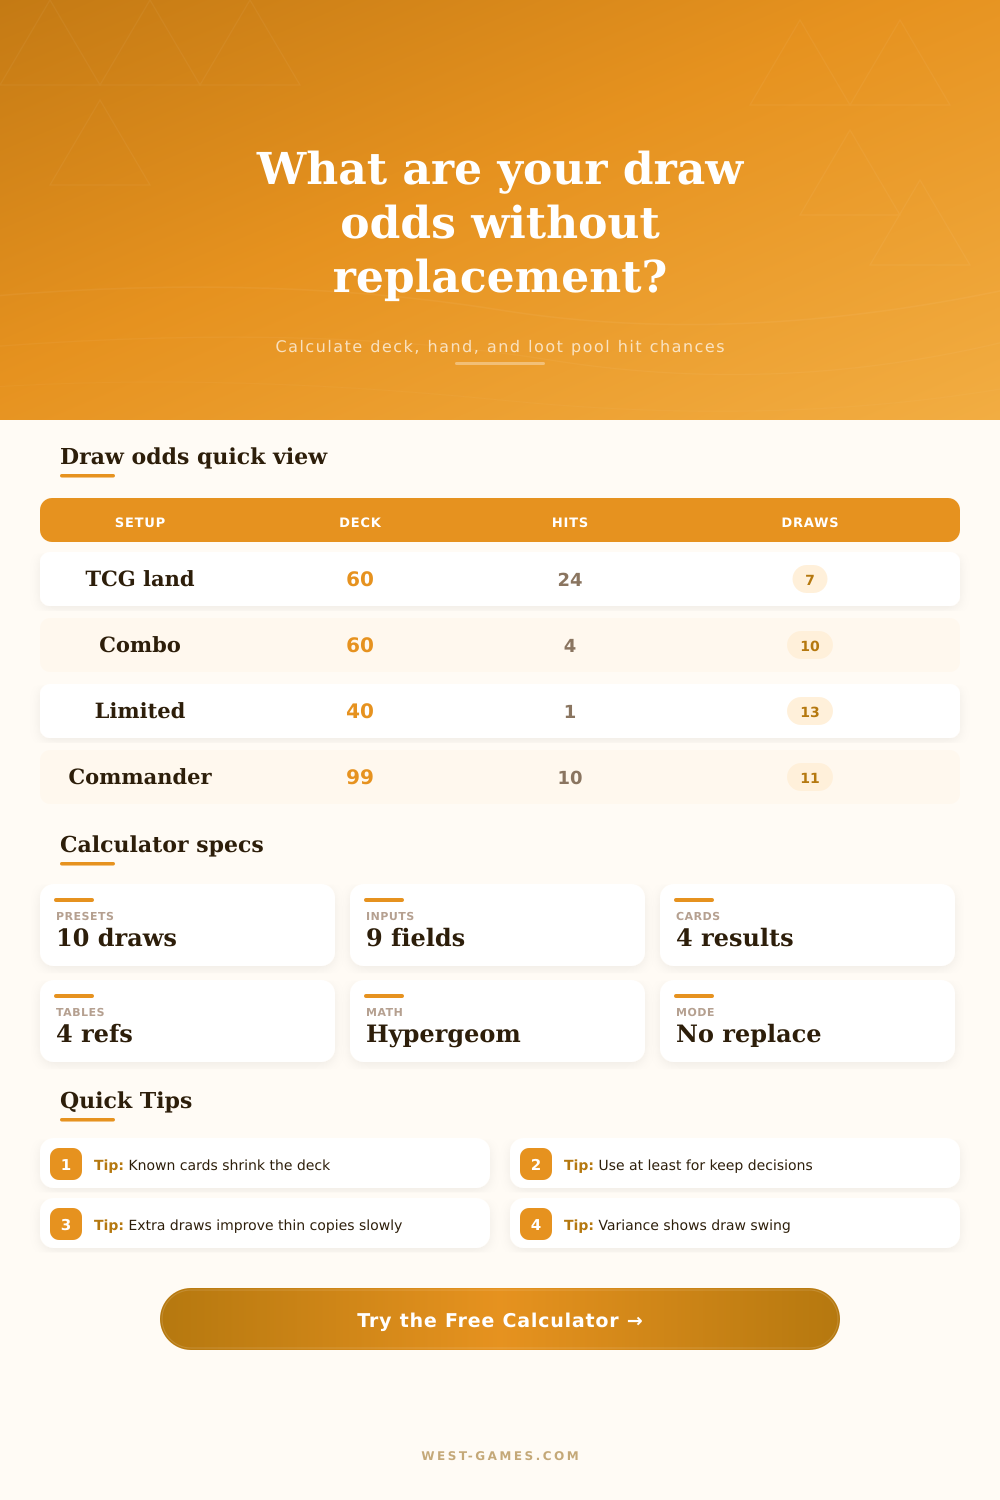
Hypergeometric Draw Calculator
Calculate card draw, opening hand, loot pool, deckbuilder, and no-replacement odds for exact hits, at least a target, at most a target, and full whiff chances.
Model: hypergeometric probability assumes a finite pool where cards, rewards, or options are removed as they are drawn. It fits deck hands, loot tables without replacement, limited drafts, and search effects.
Probability Breakdown
Distribution Read
Current Draw
Selected rule using the current adjusted deck and draw count.
One More Draw
Same setup after adding one more card, reveal, reroll, or search.
Two More Draws
Same target after two extra looks into the finite pool.
Plus One Copy
Same sample after adding one more success copy to the pool.
| Hits drawn | Exact chance | At least this many | At most this many | Visual |
|---|
Rows are generated from the adjusted pool after known success and known miss removals.
| Use case | Population | Successes | Sample | Best mode |
|---|---|---|---|---|
| Constructed TCG opening hand | 60 deck cards | 4-copy card or 22-26 lands | 7 opening cards | At least target |
| Limited deck plus turn draws | 40 card deck | single bomb or 5-8 answers | opening hand plus turns | At least 1 |
| Commander early plan | 99 card library | ramp, colors, or interaction | 7 hand plus draws | At least 1 or 2 |
| Loot pool without replacement | remaining pool slots | rare or target rewards | chests opened | Whiff or at least |
| Draft pack signals | pack or wheel pool | playables in color | visible picks | At most target |
| Mode | Notation | Use it when | Output meaning |
|---|---|---|---|
| Exactly target | P(X = k) | you need a precise hit count | one single row of the distribution |
| At least target | P(X >= k) | your hand is keepable at k or more | right-side cumulative chance |
| At most target | P(X <= k) | too many copies is a failure state | left-side cumulative chance |
| Zero successes | P(X = 0) | checking whiff or brick risk | chance no target appears |
| Deck profile | Deck | Hits | Draws | At least 1 |
|---|---|---|---|---|
| 4-copy staple in constructed | 60 | 4 | 7 | 39.95% |
| 8 one-drop starters | 60 | 8 | 7 | 65.35% |
| 24 land mana base | 60 | 24 | 7 | 97.84% |
| 1 bomb in limited deck | 40 | 1 | 7 | 17.50% |
| 10 ramp pieces in Commander | 99 | 10 | 7 | 53.34% |
| Stat | Formula input | Interpretation | Watch point |
|---|---|---|---|
| Population N | remaining cards/items | total possible draws | known cards reduce it |
| Success K | wanted cards/items | available hits | removed hits matter most |
| Sample n | draws plus reveals | cards checked | cannot exceed population |
| Target k | needed hit count | success condition | mode changes the question |
| Variance | distribution spread | draw swing measure | small pools can swing hard |
You shuffle a sixty-card deck and get twenty-four lands into it. When you draw seven cards to begin your game, however, you find just one mana source among them. Bad luck? Not really; it’s math. Math that works precisely how it should of. These instances is subject to what mathematicians call the hypergeometric distribution.
Essentially, when you’re drawing from a finite pool without replacement, like you do when shuffling up a deck, you’re altering the makeup of what’s left behind with each draw. That subtle difference are the reason that your gut instincts on probability so frequently fail you around the table.
Why Math Beats Luck in Card Games
Once you’ve described your particular constraints, the calculator above does all the math for you. Enter the size of your entire population (say, a ninety-nine card command library or a sixty-card constructed deck). Next, tell it how many successful copies is in that group (for example, how many mana rocks or key combo pieces do you need?).
It factors in variables you know about, like if you’ve scouted some stuff using other abilities on turns past, so it updates based off what’s been revealed. It also automatically accounts for when you’re not 100% sure of something, like a land going into play, you now have one less land in your deck but your land density goes way up because you know two are currently out of play.
Hypergeometric probability is frequently mistaken for raw percentages, and this stems from human nature: most of us perceive probabilities as independent events. We believe that drawing a random card from a sixty-card deck split into twenty-four lands has a 40% chance of yielding any one specific card. But we’re wrong, since our sample population shift after every draw.
Draw a non-land; now there are twenty-four lands remaining in a deck of fifty-nine cards. Your odds have increased. Draw a land. Now there are only twenty-three lands in a pool of fifty-nine. Your odds of drawing another land immediately decrease. Your numerator is getting smaller while your denominator grows smaller; this give rise to the bell-curve distribution that either makes your plan sound or makes it reckless.
But there is much more to it. On the page, there is a very helpful reference table that outlines various common scenarios so you can see where your own builds fall. Adding an additional copy of a card increase your odds…but it does so with decreasing returns. For example, switching from 2 copies to 3 may seem like a huge change, while switching from 3 copies to 4 provides less extra value then you think.
And that creates difficult design decisions. Should you play more copies to get a better floor (and take the risk of flooding), or should you play fewer copies to reduce the chance of having multiple cards in your hand at once? The variance stats shown by the tool shows the trade-off. The higher the standard deviation, the more wildly different your games will be. Some are miracles, some are brick walls.
But equally important are whiff rates: How many times am I likely to draw no copies of my removal spell by turn four? For an aggressive strategy like this, where you have to find an answer quickly, that information help you understand if your deck is too thin (meaning there is more than a 20% chance of missing the mark). But adding more copies to thicken the deck impacts other areas of consistency. It’s a balancing act: How hard do you want to hit versus how often?
With the mode selection, you can get a feel for those chances from multiple perspectives, maybe you don’t mind as long as it doesn’t totally miss, or maybe you really just need to hit exactly X.
Finally, deckbuilding is less about removing uncertainty than understanding it. You have no influence on the shuffle. You have some influence on the order of things being shuffled. Stop guessing and start designing by imagining the interaction between your copies and the draw mechanics. Your hopes don’t matter; the numbers do. And they respect a well-constructed deck.
Begin to think about each card drawn as changing the shape of the future odds. Recognize that the deck isn’t a fixed list. It is a livig system of odds just waiting to be adjusted.