🎯 Elo Expected Score Calculator
Calculate the Elo expected score formula from player rating, opponent rating, rating spread, draw probability, match count, team averages, expected points, and score target variance.
| Player spread | Expected | Opponent | Practical read |
|---|---|---|---|
| -400 | 9.1% | 90.9% | Heavy underdog |
| -200 | 24.0% | 76.0% | Upset required |
| -100 | 36.0% | 64.0% | Slight underdog |
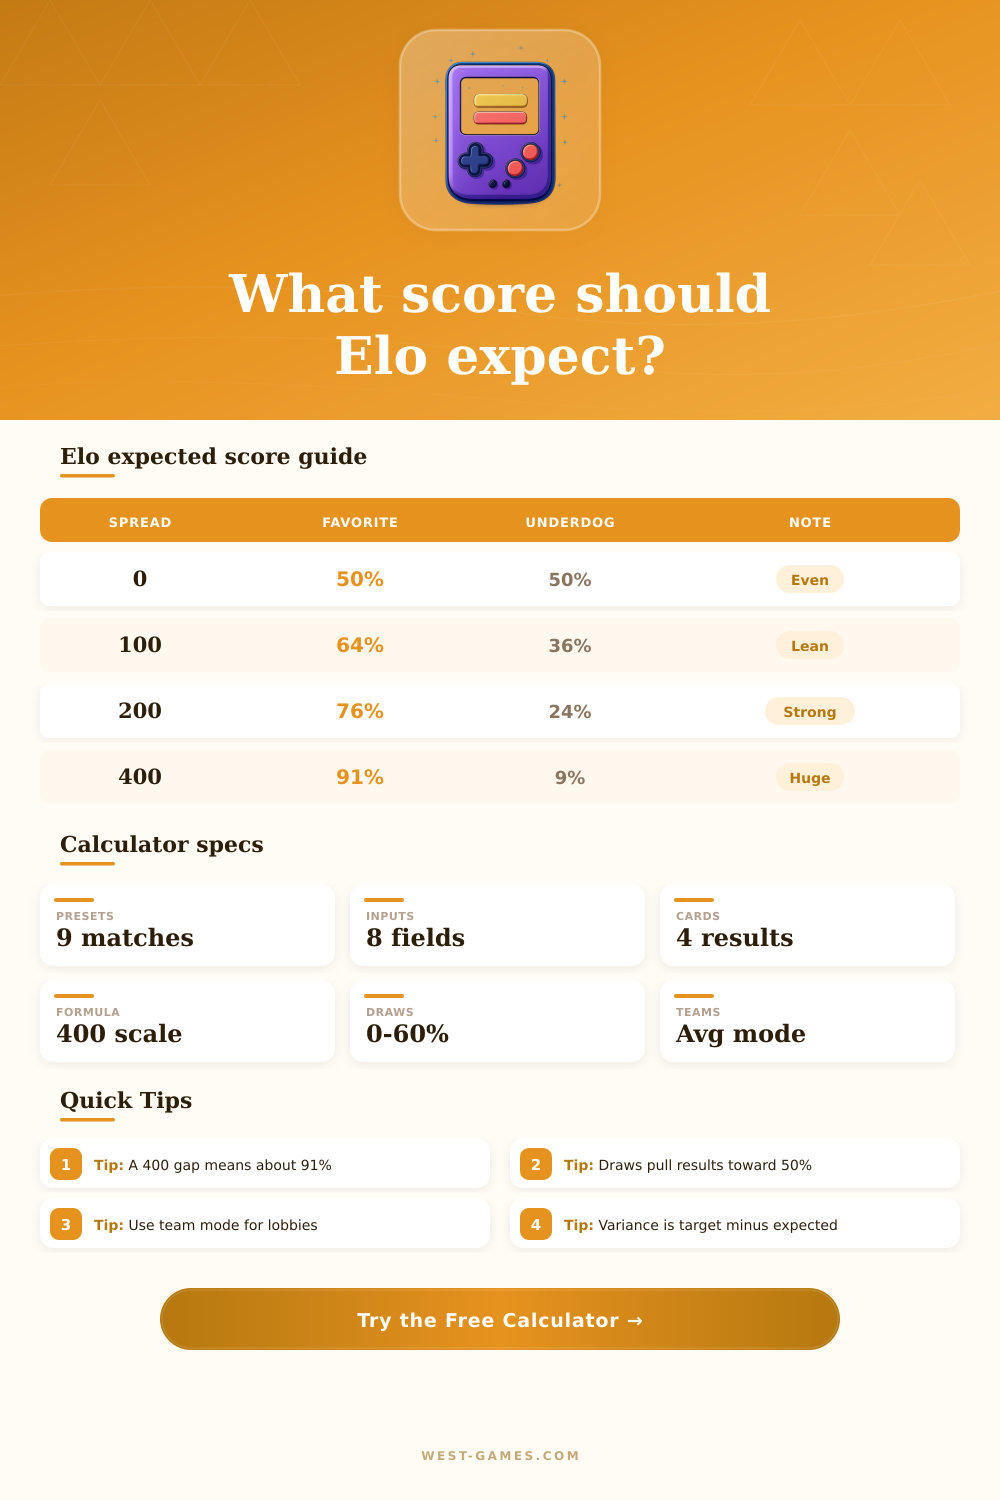
| 0 | 50.0% | 50.0% | Even pairing |
| +100 | 64.0% | 36.0% | Slight favorite |
| +200 | 76.0% | 24.0% | Strong favorite |
| +400 | 90.9% | 9.1% | Dominant favorite |
Values use the standard 400-point Elo curve before adding a separate draw-probability assumption.
| Expected score | 1 match | 5 matches | 20 matches |
|---|---|---|---|
| 25% | 0.25 | 1.25 | 5.00 |
| 40% | 0.40 | 2.00 | 8.00 |
| 50% | 0.50 | 2.50 | 10.00 |
| 60% | 0.60 | 3.00 | 12.00 |
| 75% | 0.75 | 3.75 | 15.00 |
| 90% | 0.90 | 4.50 | 18.00 |
Expected points equal expected score multiplied by match count. A win is 1 point, a draw is 0.5, and a loss is 0.
| Decisive win chance | Draw chance | Expected score | Effect |
|---|---|---|---|
| 64.0% | 0% | 64.0% | Pure decisive model |
| 64.0% | 10% | 62.6% | Closer to 50% |
| 64.0% | 25% | 60.5% | Drawish format |
| 76.0% | 15% | 72.1% | Favorite softened |
| 36.0% | 15% | 38.1% | Underdog helped |
This model reserves the draw share first, then applies the Elo curve to the remaining decisive outcomes.
| Mode | Formula ratings | Best use | Watch-out |
|---|---|---|---|
| Solo | Player vs opponent | 1v1 ladder | Ignores roster help |
| Team | Team avg vs team avg | Stacks and lobbies | Hides carry gaps |
| Blend | 60% solo, 40% team | Party queue | Approximation only |
| Season | Same ratings, many games | Variance planning | Ratings may move |
Use the mode that best matches how the pairing was actually created. Team averages are most useful when one score represents a whole side.
Look at your rating on that screen in match queue. Do you think it’s a static number? It isn’t. It’s a probability distribution. Players see rank, they see skill. The math see an expected score, a prediction of how many points you’ll get if standard statistical laws holds true. That’s what separates gambling on matches from managing risk over a season.
This is built around a logistic function that convert the difference between ratings into a probability of winning. If you and your opponent share an identical rating, then the expected result is precisely 50%, you’re on even money. As soon as you include any sort of spread, however, the curve begin to bend. Having a 100-point advantage doesn’t mean you’ll double your wins: instead, your chances of winning the point are somewhere in the neighborhood of 64%.
How Game Ratings Work
That slight detail matter. Our brains assume that a small improvement in quality lead to a much bigger payoff. It does not, which makes upsets hurt more then they should.
Simply inputting your ratings lets the tool do its thing. It doesn’t just calculate winning/losing; it factors in draw (which is important for chess since stalemates happen frequently). A high chance of a draw will tend to pull the expected score toward the middle line. That softens the blow for the favorite, providing a lifeline for the underdog. With a dominant rating gap, you may think you’d be getting more guaranteed points. But that’s not necessarily so if draws is common in your game format.
And then there’s the issue of team dynamic, something that complicates any metric of player performance. If your own rating in an MP environment skews far off your roster average, don’t assume that your personal rating are a reliable metric of your performance. There’s a blend mode option available on the calculator that lets you adjust your score relative to your entire lobby’s combined skill level. That means a great single-player run doesn’t necessarily mean a win for you and your team, as evidenced by their weak supporting cast. It makes you realize that what you’re doing is part of something greater.
Finally, there’s variance. How can knowing how well you’re doing matter if you don’t know how much that compares to what you should of been getting? That’s where variance comes in: this gives you a target variance value which tells you how you’re doing right now compared to your rating, whether you’re on a hot streak or in a slump. If your variance is positive, then you’re outperforming the math and perhaps due for a promotion push. If it’s negative, then maybe things aren’t going as well as they seem. Maybe you’re just having some bad luck.
This tells you when to keep on pushing (tilt) and when it might make sense to step back and reevaluate (don’t tilt). It makes the abstract measurable. In short, the ranking system isn’t meant to gauge your value as a player. Instead it’s guessing your potential from previous performance. It’s a prediction, not a morality play.
Lose that pressure by stopping seeing each game as an ego battle and start playing for the long run instead of just the next map. Your numbers are going to rise and fall, but your understanding of them can remain steady.
Actually it is more complex than it looks. You should of checked the moddern statistics before starting. It feels naturaly better when you understand.