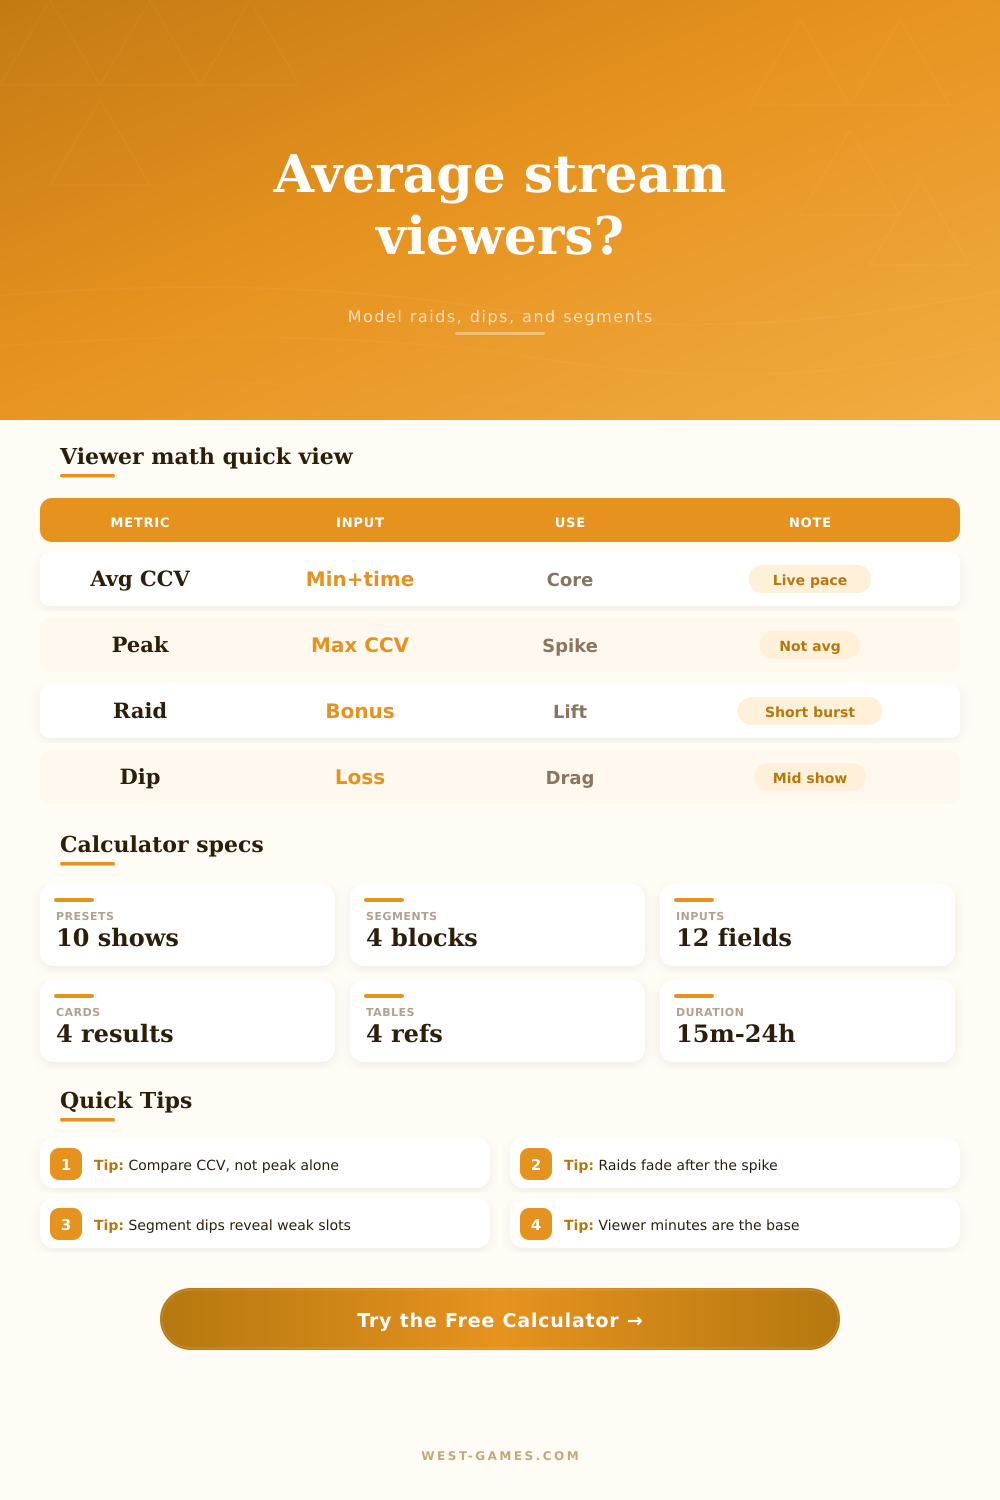
📺 Average Viewer Calculator
Estimate concurrent average viewers from total viewer minutes, stream duration, peak viewers, raids, dips, and segment-by-segment audience shape.
Segment A
Segment B
Segment C
Segment D
Highest average viewer block appears here after calculation.
Top blockLowest average viewer block appears here after calculation.
Watch dipCompares ending viewers with starting viewers.
TrendClassifies the calculated average for planning targets.
CCV band| Metric | Formula | What it means | Best use |
|---|---|---|---|
| Concurrent average | Total viewer minutes / live minutes | Average viewers present at any moment | Main stream performance metric |
| Segment weighted average | Sum of segment minutes x viewers / segment minutes | Average after respecting each block length | Comparing games, modes, and time slots |
| Peak ratio | Average viewers / peak viewers | How much of the spike became sustained CCV | Raid and event diagnosis |
| Momentum | Ending viewers / starting viewers - 1 | Whether the stream gained or lost audience | Opening and closing quality checks |
Viewer minutes are audience minutes, not watch hours. Divide by stream duration in minutes to estimate concurrent average viewers.
| Scenario | Typical shape | Average clue | Common adjustment |
|---|---|---|---|
| Game launch stream | Fast start, discovery spike, late taper | Peak may be 1.6x to 2.5x average | Use shorter launch segments |
| Raid spike stream | Large lift for 5 to 25 minutes | Average moves less than peak suggests | Fade raid viewers by half |
| Ranked grind | Slow build with match-to-match swings | Final hour often outperforms opening | Compare first and last blocks |
| Drops campaign | Long duration, steady lurk audience | Average can stay high despite low chat | Use analytics viewer minutes |
| Marathon block | Stable base with fatigue dips | Segment length strongly affects average | Watch break and meal blocks |
| Average viewers | Planning band | Peak pattern | Segment focus |
|---|---|---|---|
| 1 to 25 | Starter stream | Peaks swing heavily | Opening retention and schedule consistency |
| 26 to 100 | Growing channel | Raids can distort results | Game category fit and midstream pacing |
| 101 to 500 | Established stream | Peak should convert into sustained base | Segment testing and event timing |
| 501 to 2000 | Large stream | Peak often reflects external discovery | Break structure and raid retention |
| 2000+ | Major event | Production beats single spikes | Run-of-show and co-stream windows |
| Measure | Unit | Formula | Why this calculator separates it |
|---|---|---|---|
| Viewer minutes | Audience-minutes | Average viewers x live minutes | Base input for concurrent average math |
| Average viewers | Concurrent viewers | Viewer minutes / live minutes | Best single number for stream pacing |
| Watch hours | Audience-hours | Viewer minutes / 60 | Useful for platform analytics, but not concurrency |
| Peak viewers | Concurrent viewers | Highest observed point | Shows reach, not sustained average |
During a raid, you look at your stream dashboard and notice that two hundred viewer have jumped into your stream all at once. You’re stoked! You think to yourself, “I must be killing it!” But then ten minutes later, those viewers trickle out and the number slide back down. In that moment, that spike seems huge, but it doesn’t do much to change your overall performance.
That’s where average concurrent viewers helps: it can help distinguish between the sustained signal of what realy matters for growth (sustained viewership) and the temporary noise (viewers who come in spikes). The calculator above takes care of the math when you input your data about segments and length, so you don’t have to guess at how much weight a three-hour stretch of steady play should of held compared to a five-minute raid.
Why Average Viewers Are Better Than Peak Numbers
The biggest mistake I see most creators making is using peak viewers as their benchmark. It is an exciting number to post. However, it is statistically misleading if you are trying to measure audience retention. One huge raid. A quick spike can happen when someone discovers your stream. All of this results in a massive outlier that makes you think your room is much bigger than it actually is.
Average concurrent viewers looks at viewer minutes divided by live minutes. How many people were actualy in the room for the majority of the show? It smooths out those crazy spikes and drops and provides you with a nice flat line to get a feel for how engaged your audience really was. Most people miss that when they freak out about the highest number they’ve seen on-screen.
Its inputs are meant to match the chaotic nature of streams: an audience that comes and goes in waves. You can input your stream in chunks and determine what pieces keep people watching and which trigger them to bail out. Perhaps there’s a technical hiccup somewhere, like a game swap or a loading screen. Whatever the case, you enter how long that segment lasts and how many people it impacts. Quantifying it is better then simply having a sense for its effect.
Raid lifts get their own treatment too. They’re not sticky, so you don’t want to assume that half the people who join the raid with you will stay after 10 minutes. So you fade the raid count back down, recognizing that people will bounce out. That keeps you from overestimating how big your community actualy is due to borrowed traffic.
That’s why a raw number isn’t as helpful as understanding the shape of your stream. What if you averaged 50 viewers during the first hour and two hundred during the second? That one-hundred-twenty-five average obscures how poorly you began. Comparing segments shows whether you’re gaining momentum or falling behind.
Often, a successful channel will see its viewer trickle in gradually as word-of-mouth through chat catches up. Struggling channels may spike early with their hard-core regulars, but then lose ground as they fail to convert new visitors. On the page, the reference tables break down these scenarios, such as a game launch or a charity marathon. Each scenario have a distinct curve of viewers. This means each one needs a matching type of analysis.
But it is also worth considering how these metrics work. The main basis of streaming analytics is viewer minutes: depth plus breadth. Watch hours are great when your platform pays out on them (but they don’t speak to concurrency). Ten thousand watch hours might mean a hundred people who watched for an hour; it could be a thousand who watched for an hour each. Average concurrent viewers clears up this confusion.
It compels you to consider the actual number in the room at once, which dictates things like community health, chat velocity and (most relevantly) what sponsors will pay.
Finding your weak spot: To fix your pacing, start by finding out what your weakest link is. Did you see a dip in your viewer count each time you changed games? Look into that. Perhaps it’s because the new game isn’t as popular, or maybe changing games interrupts the flow and makes things seem disjointed. By using this tool, you’ll find those pain points so you can go in and fix them. Instead of guessing why it didn’t feel right while you were streaming, you can use hard data. This tells you exactly when you lost some of your audience and how you can adjust to match. This will help you make changes based off of specifics instead of trying to improve something vaguely.
But really, that’s the point of all this: Streaming is a game not only of acquisition, but also of retention. Algorithm luck might get you an influx of new people through a clip or a raid, but keeping those people engaged, keeping them coming back for more… Takes good content and a good pace. And while average viewers won’t necessarily tell you when something is going well, it will give you a better idea over time. It’ll keep you from panicking at each dip or celebrating each spike. It’ll help you tell the difference between a steady baseline and a short-lived surge. This way, you can make better decisions about what sort of content to produce, how to build your community, and even how to choose times to stream.
That’s where the power of average comes in: It goes beyond just stats and begins to paint a picture of who your audience is, why they stick around… and how to keep doing that.