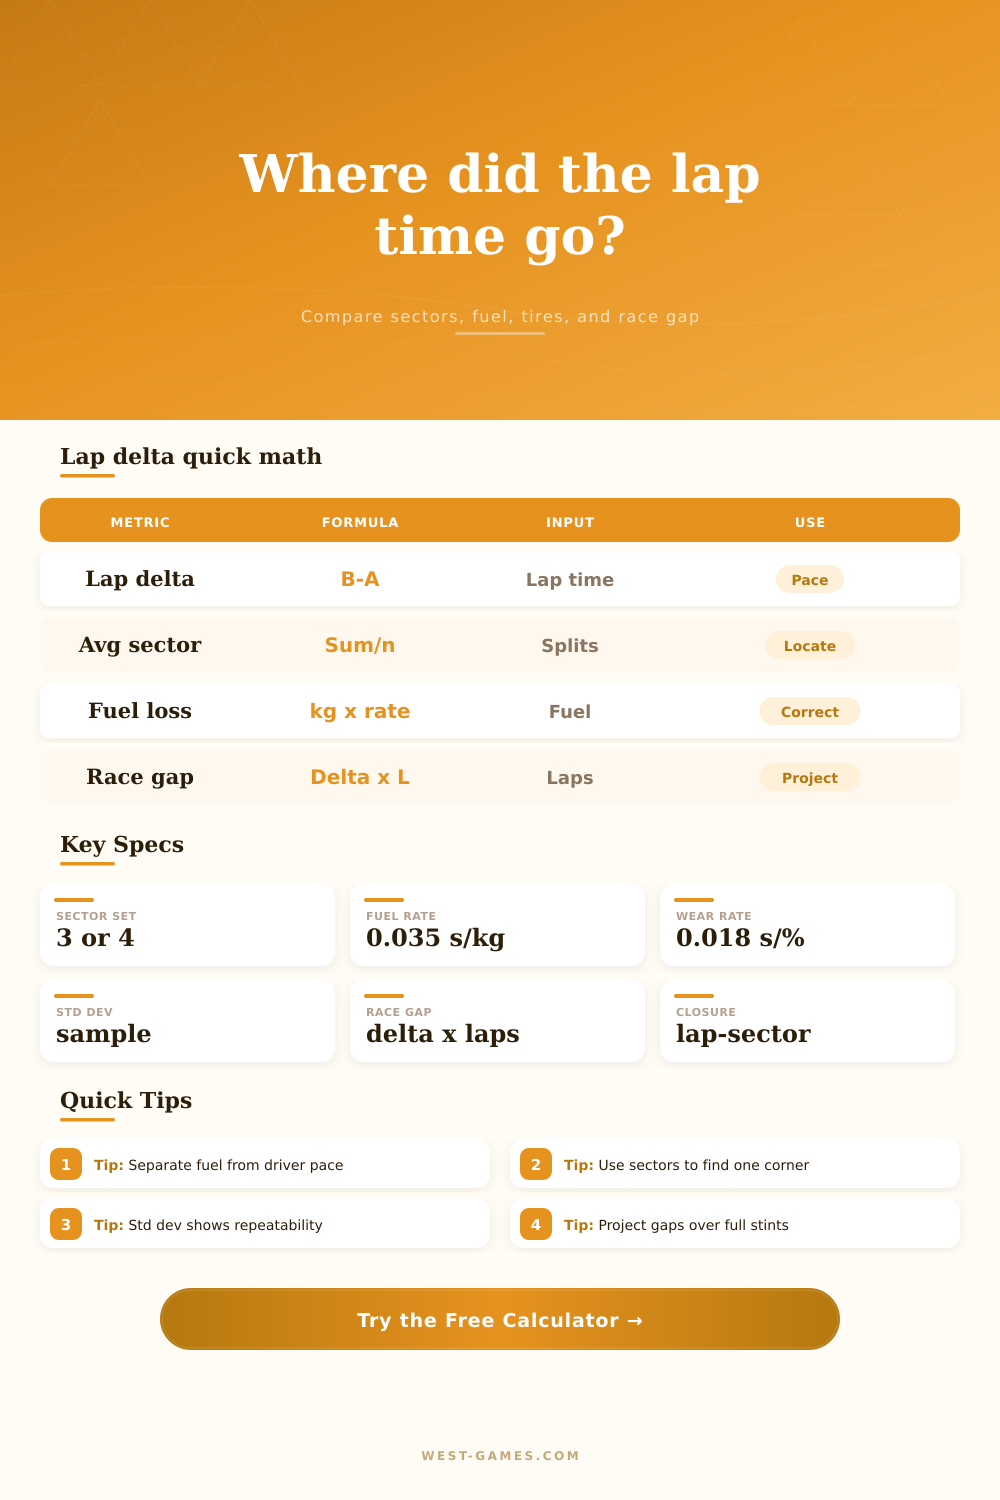
Lap Time Delta Calculator
Compare a reference lap against a target lap using sector splits, fuel load, tire wear, recent-lap consistency, and full-stint projection for cleaner sim racing analysis.
| Output | Formula | Positive Means | Best Use |
|---|---|---|---|
| Lap time difference | Comparison lap - reference lap | Comparison lap is slower | Direct stopwatch pace comparison |
| Average sector delta | Sum of active sector deltas / sector count | Average split is slower | Normalize three-sector and four-sector layouts |
| Fuel load penalty | Extra fuel kg x seconds per kg | Heavier car costs time | Separate fuel state from driver pace |
| Tire wear penalty | Wear percent difference x seconds per percent | More worn tire costs time | Compare laps from different stint ages |
| Consistency standard deviation | sqrt(sum((lap - mean)^2) / (n - 1)) | Laps vary more | Estimate repeatability of the pace |
| Race gap projection | Adjusted lap delta x laps + consistency buffer | Gap grows over the run | Estimate stint or race-time impact |
| Correction | Light Impact | Medium Impact | Heavy Impact | Notes |
|---|---|---|---|---|
| Fuel load | 0.020-0.030 s/kg | 0.030-0.045 s/kg | 0.045-0.070 s/kg | High-downforce cars and short tracks can vary widely. |
| Tire wear | 0.006-0.012 s/% | 0.012-0.025 s/% | 0.025-0.050 s/% | Penalty often rises faster near the grip cliff. |
| Traffic loss | 0.00-0.10 s/lap | 0.10-0.50 s/lap | 0.50+ s/lap | Use negative values for draft or tow gain. |
| Consistency spread | 0.000-0.150 s | 0.150-0.500 s | 0.500+ s | Clean samples are more useful than mixed incident laps. |
| Preset | Sector Layout | Main Correction | Projection Use | Reading |
|---|---|---|---|---|
| GT3 Spa Chase | 3 sectors | Moderate fuel and tire wear | 24-lap stint | Find whether the gap is pace or car state. |
| Formula Qualifying | 3 sectors | Minimal fuel, tiny wear delta | 8-lap run | Focus on sector precision and lap closure. |
| Prototype Heavy Fuel | 4 sectors | Large fuel correction | 36-lap stint | Show how heavy fuel hides true pace. |
| Touring Tire Fade | 3 sectors | Large wear correction | 18-lap race | Separate fading tire from line choice. |
| Drying Track Delta | 4 sectors | Traffic and surface swing | 14-lap run | Use closure to spot inconsistent split timing. |
| Per-Lap Delta | Single Lap Meaning | 20-Lap Effect | Likely Cause | Next Check |
|---|---|---|---|---|
| 0.000-0.100 s | Almost even | 0.0-2.0 s | Execution noise | Look at consistency std dev. |
| 0.100-0.300 s | Small but real | 2.0-6.0 s | One sector or minor correction | Compare sector delta and fuel load. |
| 0.300-0.800 s | Clear pace gap | 6.0-16.0 s | Technique, traffic, or tire age | Review biggest sector and wear state. |
| 0.800+ s | Major gap | 16.0+ s | Incident, setup, fuel, or track state | Check lap closure before judging pace. |
While most sim racers obsess over the last lap time, which they regard as ultimate judge of their driving skill, raw lap times aren’t necessarily indicative of all that occurred during the session. Because traffic, tire wear, and fuel weight is not taken into consideration, we must draw a distinction between real pace and outside factors.
Once you input state of your car and split times for each sector, the tool located on this page will perform necessary calculations for you. No need to guess at coefficients; rather, it’s a clear picture of what happened out on the track.
How to Check Your Real Driving Speed
First, you have to pick out a reference lap where you drove without any mistakes. Once you know what the reference is, then we takes your target lap and subtract off the reference. We call this raw delta. If comparison lap is faster, the delta will be negative. If comparison lap is slower, the delta is positive.
That’s your start point, but it’s not necessarily the whole story. Maybe there was extra tire wear and extra fuel cost. It may appear as a three-tenths gap which could indicate poor driving, but really it’s just more fuel and tires. What the calculator do is remove those physical penalties to reveal how well you did.” Too few analyses accounts for tire and fuel adjustments. Determine how many seconds each percent of tire wear steals, and how much time each kilogram of fuel costs.
The reference table shows average coefficients; your vehicle or track might be different than this. Lightweight touring cars won’t suffer as much from fuel weight as high-downforce prototypes. Soft tires wears out quicker then hard ones. These adjustments are just guesses, not perfect physics simulations. Adjust them so you aren’t blamed for car’s weight. Leave the fuel load out, and you’ll assume you’re slow; you’re just lugging too much around.
The time is broken down by sectors. The split between each sector will tell you what and where to focus on. Total lap delta tells you the size of the issue. But the sector deltas gives you an exact place.
Maybe I got on the brakes too late so now I lost three tenths in the first sector. Or maybe I got off the throttle too early so now I lost two tenths in the second sector. Now we have a specific area instead of just thinking something isn’t quite right with my whole rhythm. It makes it very concrete, here’s a thing I can work on specifically in this next lap.
Speed isn’t everything; consistency is also key. Two minutes and eighteen seconds for a single lap sounds nice, until you realize that the next five laps has a three-tenth spread across them. This scatter is measured in the standard deviation calculation which shows how consistent you are on similar conditions. Low standard deviation = you’re reliable, high standard deviation = you’re unpredictable.
Winning races more often come from being reliable, not occasionally brilliant, because you have to set up a lap multiple times to win a stint. If you project this difference out to a whole stint of racing, does that little bit matter? Does that half-second per lap difference not seem too bad? Nope. Twenty laps later, that’s a ten-second deficit. Forty laps later, that’s the difference between winning and losing the race.
The race gap projection is your adjusted delta times amount of laps multiplied by some buffer for variance, which allows you to consider the long game. While most drivers are thinking about upcoming corner, great drivers are thinking about the next twenty corners. That change in thought makes all the difference between being a good driver or a great one.
Only do this analysis on clean data (no braking errors), no off-track excursions, no traffic incident laps because they screw up the standard deviation. This isn’t about how bad you are. You want to see what your pace realy is. Clean out the sectors; remove any noise from the data and adjust based off the state of the car. That’s when you’ll get a good idea of your actual performance delta.
Pace is more than just a number. Pace is a pattern. It is a little thing, but it makes all the difference.