iRacing Safety Rating Calculator
Estimate iRacing Safety Rating movement from corners completed, incident points, session weighting, clean corner trend, license class thresholds, and recent corners-per-incident history.
Calculation Breakdown
| Concept | Public detail | Calculator input | Estimator effect | Precision note |
|---|---|---|---|---|
| Incident points | 1x, 2x, and 4x points are summed for the session. | Session incident points | Higher incidents lower CPI and SR trend. | No fault assignment modeled. |
| Corner count | Each track configuration has a corner multiplier. | Laps x corners per lap | More clean corners improve CPI. | Use official result data if available. |
| Session type | Race sessions count fully; some ranked sessions have reduced weight. | Ranked session type | Weights corners and incidents together. | Public multipliers can change. |
| Rolling record | SR updates from recent ranked activity, not one race alone. | Recent CPI or counts | Blends new session into prior trend. | Window length is modeled. |
| Whole number bump | Visible SR receives extra movement crossing whole numbers. | Bumper model selector | Adds or subtracts about 0.40 SR. | Visible mapping is approximate. |
| Item | Public value | Typical source display | Calculator handling | SR direction |
|---|---|---|---|---|
| Wheels off racing surface | 1x | Off track | Add to incident points | Negative |
| Loss of control | 2x | Car control incident | Add to incident points | Negative |
| Contact with object | 2x | Wall or object contact | Add to incident points | Negative |
| Heavy car contact | 4x | Driver contact | Add no-fault total | Negative |
| Race or heat | 1.00x | Ranked race result | Full weighted session | Largest effect |
| Open qualify or warm-up | 0.50x | Ranked event session | Half weighted estimate | Medium effect |
| Time Trial or lone qualifying | 0.35x | Ranked solo session | Reduced weighted estimate | Smaller effect |
| Other session types | 0.00x | Unranked or excluded | No SR change estimate | No effect |
| License class | Visible SR range | Season promotion | Fast track | Season risk | Immediate risk |
|---|---|---|---|---|---|
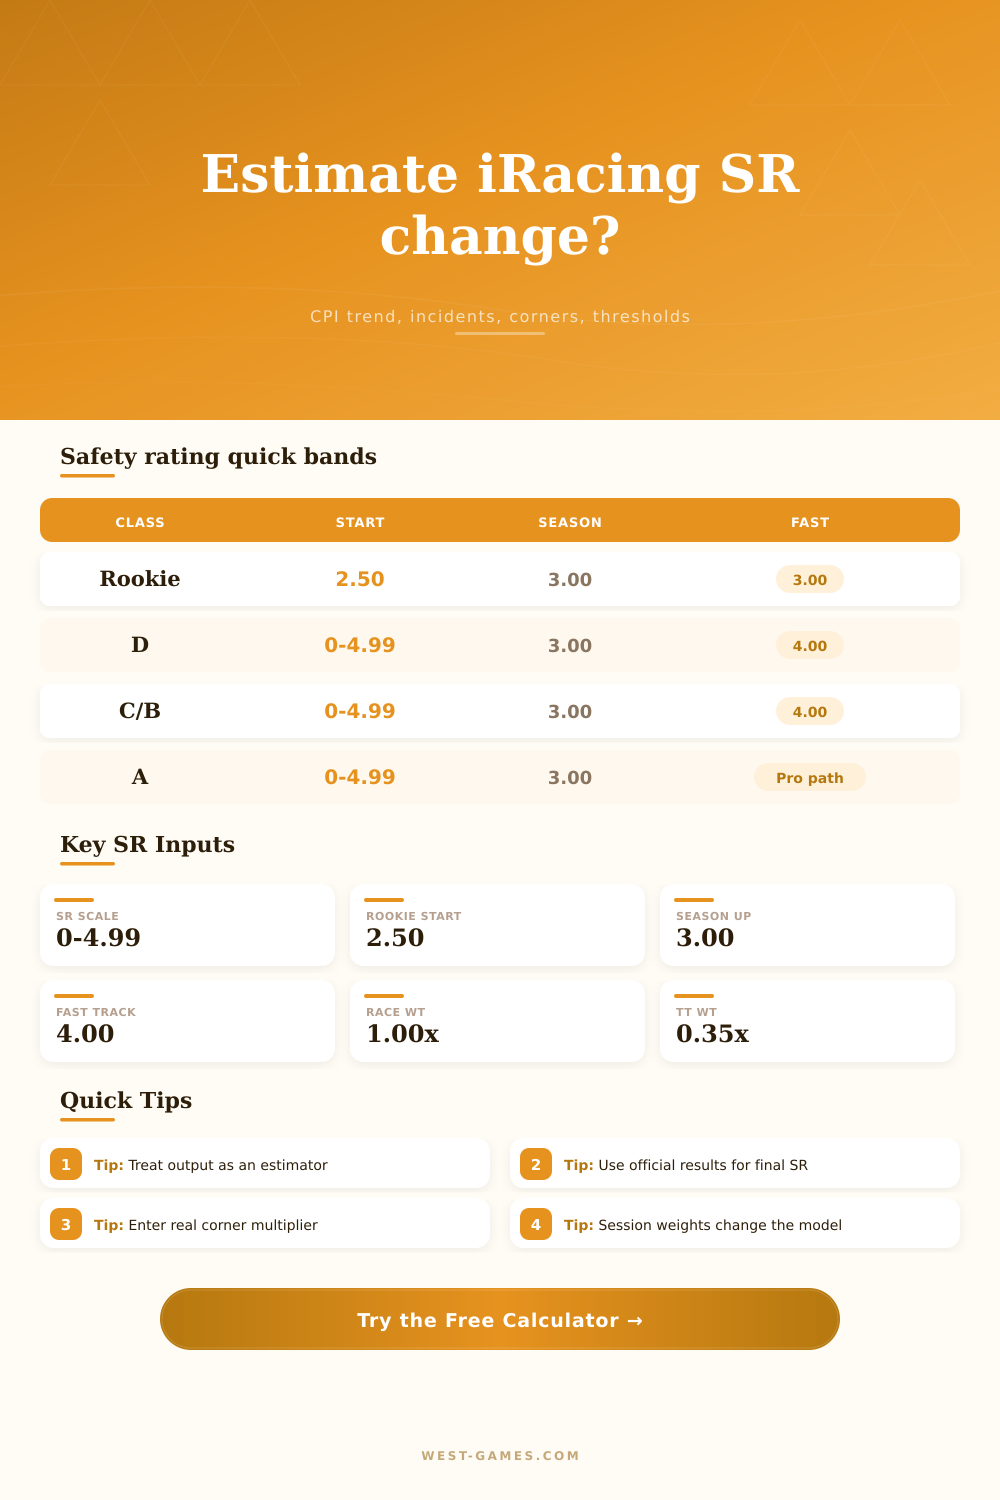
| Rookie | 0.00-4.99 | 3.00 plus MPR | 3.00 plus MPR | Special rookie handling | Special rookie handling |
| D | 0.00-4.99 | 3.00 plus MPR | 4.00 plus MPR | D demotion rules differ | D demotion rules differ |
| C | 0.00-4.99 | 3.00 plus MPR | 4.00 plus MPR | Below 2.00 | Below 1.00 |
| B | 0.00-4.99 | 3.00 plus MPR | 4.00 plus MPR | Below 2.00 | Below 1.00 |
| A | 0.00-4.99 | Class A hold | Pro path rules | Below 2.00 | Below 1.00 |
| CPI band | Incident pace | Estimated SR pressure | Common result | Model use |
|---|---|---|---|---|
| Under 10 | Frequent incidents | Strong negative | SR usually falls | Low CPI anchor |
| 10-20 | Busy incident log | Negative to mixed | Class dependent | Rookie/D sensitive |
| 20-35 | Moderate record | Near neutral | Small move | Middle band |
| 35-55 | Clean trend | Positive | SR tends upward | Promotion watch |
| 55-80 | Very clean trend | Strong positive | Higher class support | A/B model band |
| 80 plus | Rare incidents | Very strong positive | Fast gain potential | Clean ceiling band |
After a clean stint, there is something about that silence; it feels like a reward for not having done anything wrong. At the end of the day, you have no incidents in a race and you get a little bump up in your stats. And that’s what frustrates so many guys who is trying to work their way up the ladder. Reckless behavior gets filtered out, but those of us who are simply trying to hang on, we feel like we’re in this unclear system. If you don’t understand how that rating go up, you need to look at the trend over time instead of single instances.” That’s what this calculator on this page attempts to simulate: it combines both new data from a session and some historical information to get a rough estimate of how things will shake out.
This isn’t a perfect simulation of the proprietary formula, but it gets at the public face of scoring mechanism. The formula wants to know what class of driver license you have now. What was your starting rating? What is your most recent corners-per-incident number? That last one pins down where you think your rating ought to go. A high number mean you’ve been clean for a while and the system expects your rating to go up.
How the Rating System Works
Finally, how important was this session? That’s the weight we’re interested in. A race counts for a lot, while a warm up count for very little. Driving clean is a factor, but racing clean is primary thing that accelerates your progress up the ratings ladder.
Drivers tend to fixate on the incidents they rack up during a race. They get flagged for two points, so they expect their rating to take a huge hit. What they fail to consider is the rest of the context, the number of corners they made without trouble prior to screwing something up. Even though you tapped the wall once during a 50 lap race, that’s meaningless compared to remaining 40 clean laps.
That’s what C/PI measures: the ratio of corners you’ve completed per incident. It also rewards doing a lot of them. As you string together more laps of not being penalized for something, you build up more protection against mistakes. You can screw one thing up every now and then and it won’t hurt as much when you have a ton of other stuff to offset it with. The reason enduros is good at grinding up a license is because they have a lot of corners which helps push up your average. It evens out the roller coaster ride from short sprints.
Then there’s the added complication of license promotion thresholds, which the tool help to visualize. Barriers at whole numbers are visible, creating a buffer to keep drivers out of trouble if they’re hovering right around the edge. But when you do go over them, your performance must be consistent and then stay that way. You need an additional bump to cross those same lines in the positive direction. The calculator has a toggle to represent this, which shows how much harder it can be to get into a higher bracket.
It’s one thing to make it past the magic number. It’s another thing to stay there long enough for the rolling average to catch up. A lot of drivers reaches the threshold, take a deep breath, and think they’re safe. They relax their discipline. The system punishes that complacency just as much as it rewards caution. It does this by letting the rating slip back down.
Early on, session type is critical. If you’re having trouble getting the hang of things, go run some time trials. Build up those corner counts without the pressure of competing against anyone else’s car. It is a slow climb but it is less risky than diving headfirst into a heat race where someone is bound to tap you sideways. Once your rating starts to rise, the ranked races start to count more, requiring clean runs at higher levels of pressure.
Often the toughest jump is going from D to C class. Competition get tighter and the room for mistakes grows smaller. Your driving needs to change to deal with more car on track, but you also have to keep the discipline that earned you the spot.
To conclude. The rating isn’t based on your ability at any one race; it’s based on your consistency across races. Being fast doesn’t equate to having a high rating, because you might make too many mistakes. Being slow doesn’t mean you have a low rating, either; you could just be boringly clean. It all comes down to bringing both speed and discipline together.
Log-in, but don’t log-in yet. Simulate a few scenarios. How would a clean race compare to a messy race? What about your ranking? Setting realistic expectations will help you reduce your frustration when your number stalls out. And while the quiet after a clean stint feels good… it only becomes progress once you understand why the rating changed.