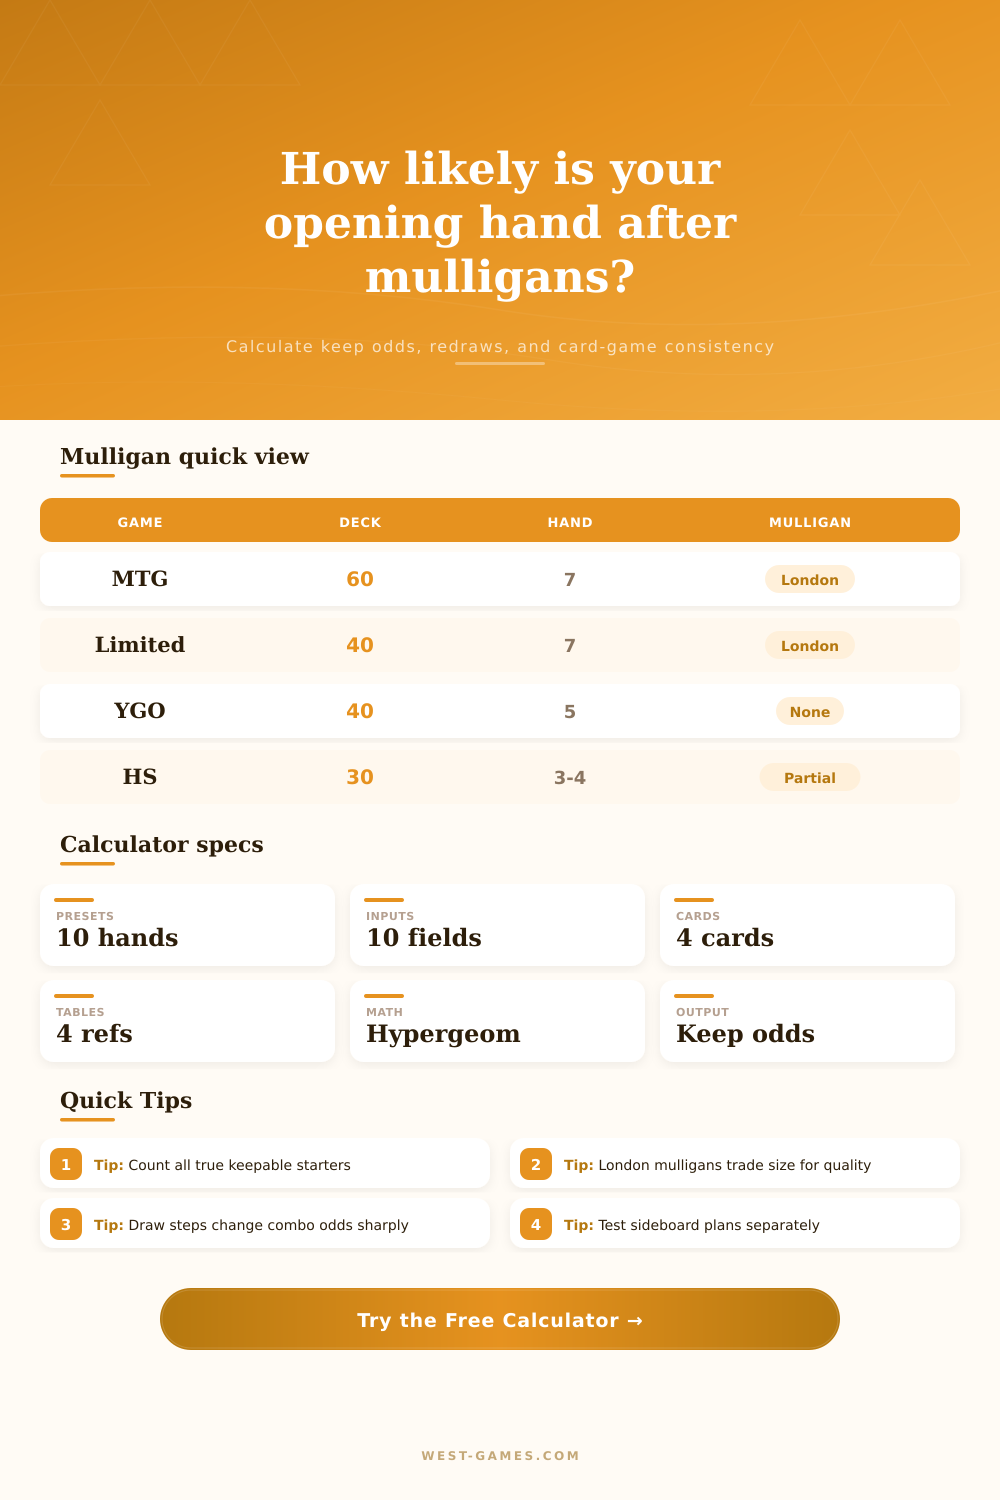
Mulligan Probability Calculator
Estimate how often an opening hand meets your keep rule, how much each mulligan improves the search, and what your final hand size looks like under common card-game mulligan systems.
Model note: this calculator treats the target cards as interchangeable hits and uses hypergeometric probability. For partial mulligans, set the search hand to the number of cards you replace or redraw.
Calculation Breakdown
| System | Typical games | Probability meaning | Hand-size impact |
|---|---|---|---|
| London mulligan | Magic formats using current mulligan | Redraw full hand, then put one card back per mulligan kept. | Search stays high; final hand shrinks. |
| Vancouver mulligan | Older Magic rules and house variants | Each mulligan draws one fewer card, usually with a scry after keeping. | Both search and final size shrink. |
| Partial redraw | Hearthstone-style opening replacement | Only selected cards are replaced, so set search cards to replacement count. | Hand size usually stays fixed. |
| One free redraw | Some casual, digital, and multiplayer rules | First bad hand can be replaced without a hand-size penalty. | Second keep may still be full size. |
| No mulligan | Games or queues without redraw decisions | Only the initial hypergeometric probability matters. | No penalty and no rescue chance. |
| Deck pattern | Example ratio | 7-card expectation | Best keep range |
|---|---|---|---|
| 60-card land base | 24 of 60 | 2.80 target cards | 2 to 5 lands for many midrange plans. |
| 40-card limited deck | 17 of 40 | 2.98 target cards | 2 to 5 lands for most draft and sealed decks. |
| 40-card combo starters | 12 of 40 | 2.10 target cards | At least 1 starter if extenders are available. |
| 30-card digital deck | 6 of 30 | 1.40 target cards | At least 1 early play or key matchup card. |
| 100-card singleton | 1 of 99 | 0.07 target cards | At least 1 specific card is a long shot. |
| Setup | Deck size | Hand size | Calculation focus |
|---|---|---|---|
| Constructed mana keep | 60 | 7 | Find 2 to 5 lands while preserving enough action cards. |
| Combo opener | 40 to 60 | 5 to 7 | Find at least one starter, payoff, or tutor class. |
| Aggro curve | 30 to 60 | 3 to 7 | Find early plays by turn one or turn two. |
| Singleton highlander | 99 to 100 | 7 | Measure single-card opener odds with mulligan rescue value. |
| Limited land mix | 40 | 7 | Avoid too few or too many resources in the opener. |
| Result band | Opening feel | Decision pressure | Practical read |
|---|---|---|---|
| Below 35% | Unreliable | High | Expect many rejected hands unless the payoff is very strong. |
| 35% to 55% | Matchup dependent | Medium high | Mulligans matter, but final hand size loss can be costly. |
| 55% to 75% | Reasonably steady | Medium | Most events produce keepable openers with normal variance. |
| 75% to 90% | Consistent | Low | Your build naturally supports the keep rule. |
| Above 90% | Very stable | Very low | The target may be broad enough that other hand qualities decide. |
We’ve all had it happen: You draw seven cards, look down and your stomach drop. The situation doesn’t seem right. Maybe there’s a wall of lands when you want spells. Or maybe there isn’t quite enough raw power to go off immediate.
In many ways, the opening hand dictates the rhythm before the first turn even ends. It sets the pace for what will become competitive play. Mulligans are about getting better cards and having a chance to play a good opening hand. This mulligan probability calculator put those odds in black and white based off your deck makeup.
Why Your First Hand Matters
This math is based on a branch of statistics called hypergeometric probability (sampling without replacement). Each time you choose a card out of a pile, it alter the makeup of that pile. It’s a complicated counting problem, but thankfully the calculator do all that for us. All we need to do is plug in how many cards are in our deck and how many we want to hit.
What’s a hit? Well, that’s something we define. If we’re building midrange, the hits is typically lands. Combo players might consider tutors and starters as their hits. Why does that matter? Because density = consistency.
Twenty-four lands in a sixty card deck is forty percent density. That doesn’t sound bad until you remember you’ll be getting just seven cards in your hand. On average you’d expect to see two or three lands, except variance isn’t linear like expectation, and a small sample size makes averages very deceiving. You’re going to get zero lands often. Or six. Either way it’s a non-starter.
One of those factor is mulligans. While they are an equalizer between skill and luck, different games handles them differently. In some older systems, such as Vancouver, drawing one fewer card was the penalty. That might find you better cards on average but at the cost of ruining your resource base. The moddern London mulligan system allow a full redraw but forces you to put a card back for each subsequent attempt. You still have search power, which balances reducing hand size when you can’t decide what to do. Finally, digital formats has tended to use partial redraws… You keep what’s good and discard the rest.
These all have their advantages and disadvantages but the key takeaway here is that you are able to separate final hand size from the number of cards drawn. This make it easy to model scenarios like “I drew 5 really good cards but then I had to shuffle out” or “I replaced 2 bad cards with another 3 good ones” etc.
A lot of players fall into a psychological trap: they drop their hand size and mulligan down to one card in hopes of getting a perfect hand. As we showed above, this is almost never optimal. By dropping your hand size drasticly, you reduce the surface area for hitting your target range. Yes, you may be getting more good cards into your hand, but you’re playing with so few that missing even once will result in failure.
This tradeoff is highlighted by the calculator’s output, which include not only keep odds, but also expected hand size. A ninety percent keep rate on a three-card hand sounds good, right? Until you remember those three cards are rarely enough to make up functional play. You need to balance the usefulness of your hand size against the likelihood of it being a hit to achieve consistency. These is as much influenced by how mulligans are handled as they are by deck construction.
Certain archetypes depend on interactions between cards, and those will be harder hit if some key component is represented poorly in a given build. If your combo require two specific singletons, the odds plummet regardless of how many times you mulligan. How many times do you have to mulligan before the odds fall off the proverbial cliff?
The page include reference tables of common patterns. You can use expected hands, based on land ratios and starter counts, to compare decks and see if a problem is simply a streak or something more fundamental. Occasionally, it takes one additional copy of a utility card to push the probability curve into a viable tournament strategy rather than a frustrating one.
You should of checked this sooner. This is the bottom line. You don’t control the shuffle. You only control the chances surrounding it. Knowing whether you’re on a strict or loose keep changes how aggressively you use mulligans. Staying back allow you to avoid hand size penalties if your starting position is already good. Pushing deeper is required if your starting position isn’t great. It’s all about survival.
Your deck need some actions to play and some resources to use them with. Getting that equation correct is a way of understanding the math versus the feel of the moment. When you have faith in the deck’s process, that first stomach plunge dissapears.