Card Draw Probability Calculator
Estimate the chance of drawing key cards from a shuffled deck, including opening hands, turn-by-turn draw depth, exact hit counts, miss odds, mulligans, deck thinning, and search effects.
Model: this calculator uses the hypergeometric distribution for draws without replacement. Mulligan odds are approximated as independent fresh looks at the same hand size, which is useful for comparing keep rules but not a substitute for a full game-specific mulligan simulator.
Probability Breakdown
Draw Reliability Read
Current Line
Uses deck size, target copies, draw depth, known removed cards, search hits, and mulligan looks.
No Mulligan
Shows the same draw without extra fresh looks so the mulligan value is isolated.
One More Copy
Adds one target copy to show how much consistency improves from another playable copy.
One More Draw
Adds one card of draw depth to compare cantrips, extra turns, and redraw effects.
| Deck format | Target copies | Hand size | At least one |
|---|---|---|---|
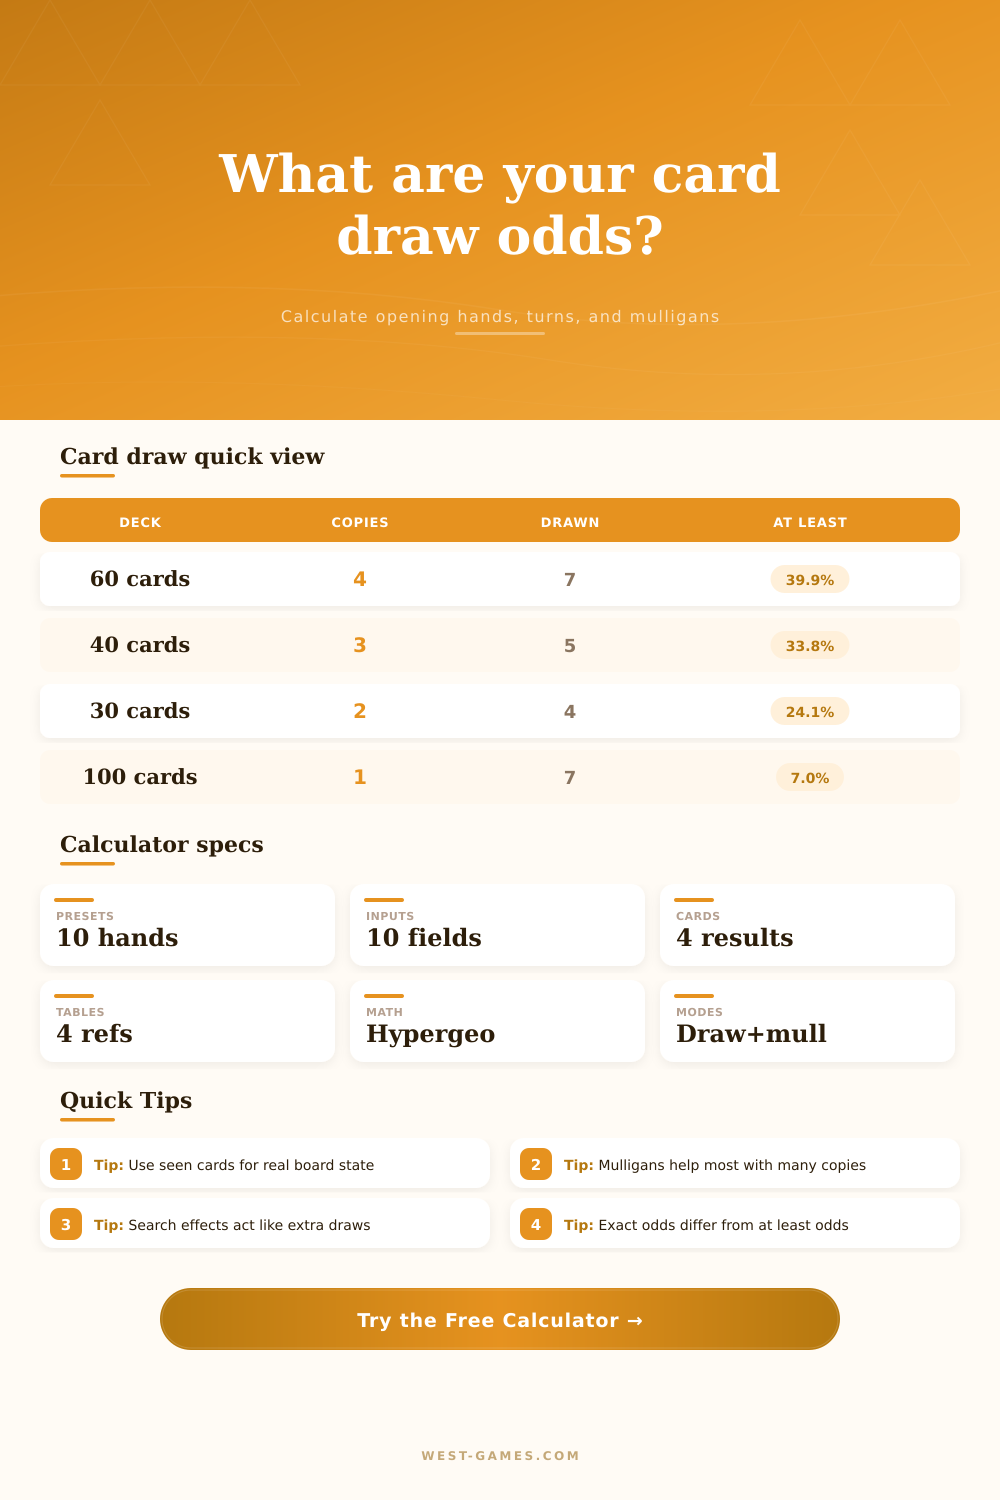
| 60-card constructed | 4 copies | 7 cards | 39.9% |
| 40-card deck | 3 copies | 5 cards | 33.8% |
| 30-card deck | 2 copies | 3 cards | 19.3% |
| 12-card deck | 1 copy | 3 cards | 25.0% |
| 99-card singleton | 1 copy | 7 cards | 7.1% |
These are no-mulligan hypergeometric baselines for common digital and tabletop card-game deck sizes.
| Deck size | Copies | Draw depth | At least one |
|---|---|---|---|
| 60 cards | 4 | 10 cards | 52.8% |
| 60 cards | 4 | 15 cards | 68.4% |
| 40 cards | 3 | 10 cards | 60.0% |
| 30 cards | 2 | 8 cards | 44.1% |
| 99 cards | 1 | 12 cards | 12.1% |
Draw depth means all cards seen from the relevant deck zone, not just cards kept in hand.
| Single hand odds | Extra looks | Keep chance | Gain |
|---|---|---|---|
| 20% | 1 redraw | 36.0% | +16.0 pts |
| 30% | 1 redraw | 51.0% | +21.0 pts |
| 40% | 1 redraw | 64.0% | +24.0 pts |
| 40% | 2 redraws | 78.4% | +38.4 pts |
| 55% | 2 redraws | 90.9% | +35.9 pts |
Formula: 1 minus the chance that every fresh look misses the selected keep condition.
| Mode | Question answered | Best use | Formula range |
|---|---|---|---|
| At least | Do I find enough? | Opening keep checks | P(X >= k) |
| Exactly | Do I draw this count? | Combo density planning | P(X = k) |
| Zero hits | Do I miss entirely? | Brick-rate checks | P(X = 0) |
| Up to | Do I avoid flooding? | Land, resource, or duplicate ceilings | P(X <= k) |
Use exact mode for precise counts and at least mode for practical consistency targets.
| Scenario | Deck size | Typical copies | Important adjustment |
|---|---|---|---|
| MTG constructed opener | 60 | 4 key copies | Use 7 drawn, then add turn draws for topdeck plans. |
| MTG Commander singleton | 99 | 1 key copy | Search and tutors often matter more than raw opening odds. |
| Yu-Gi-Oh starter check | 40 | 3 starters | Search hits can be counted as target copies or bonus hits. |
| Pokemon Basic Pokemon check | 60 | 6 to 10 basics | Use target copies for all legal starting basics. |
| Poker outs after flop | 47 | live outs | Known cards should already be removed from deck size. |
The calculator accepts any deck state, so you can model a full deck, a reduced draw pile, or a known late-game library.
When you sit across from your opponent’s board, unsure if your necessary card is sitting on top of your deck or buried deep inside, you might feel as though you’re just rolling the dice. But math exist behind the shuffling curtain of your library. Because you are drawing from a finite pool, each card drawn changes the likelihood of the next one. This means you aren’t simply rolling the dice; rather, you’re understanding the probability change that allow you to stop hoping for a miracle and start playing a calculated hand.
If you know how many copies of each card you want in your deck and roughly how large it will be, calculator above performs the math for you. The algorithm behind this is called the hypergeometric distribution, a type of statistical model used to draw from a pool without replacing the card back into pile. Because once you draw a card; like a land off the top of your deck on turn one (that card is gone from your deck). What’s left shift the odds of drawing other lands out.
The Math Behind Card Drawing Odds
A lot of people mess up here by using basic percentage thinking. Because anxiety typically begins here, most players focus intently on their starting hand. With a typical 60 card deck (containing four copies of some key land), the likelihood of drawing at least one copy into a seven-card hand is about 40%. Sounds low… until you consider that two out of every five games will start without it. If you include a mulligan, then this changes everything; each new draw represent another chance to improve.
The tool approximates these redraws so you can see how they compound your chances and how much additional safety those additional hand add. It’s not just hoping for a good start here or there; its about stacking the odds before first flip of the coin.
Depth matter too. And the game doesn’t end on turn zero. If you’re missing the first hit, how likely do you think you are to get it on turn three? You can enter number of draws and future turns for this calculation as well to see how deep into the deck you may reach before nabbing a needed resource.
This is also where search effects kick in. Scry abilities and tutors makes the deck thinner by removing non-target cards from the mix. This increases the concentration of what’s left over. That’s why a single tutor in your deck feels like double your consistency. This visual helps explain it.
The art of deckbuilding is basicly probability management. You’re balancing density against redundancy. More redundant copies of a card means more wasted draw slots as you flood yourself with duplicates. Fewer redundant copies mean you have little to show for it when you do brick, staring down at a pile of useless cards while your opponent marches ahead. And that’s exactly what the table on the page displays: the baseline odds for various deck sizes. What happens when you play a singleton command game? How does that compare to a forty-card limited format? Size matters; the number of copies in each slot matter.
In addition, keep in mind any information you have on the current state of the deck. This includes cards you’ve milled off of your own and cards visible in your opponents’ discard pile. Those are constants, and they’re not variables anymore. That also increases your effective hit rate; the fewer known cards that aren’t targets you remove, the better. When you’re sitting there debating whether or not to go all-in on a risky combo, every little bit helps.
Since this is a small adjustment, the tool lets you modify it. You can model based off the actual current state of the board instead of how it looked at the start of the game.
The thing about probability: it doesn’t always work out. You might draw seven instants when you had a ninety percent chance of drawing your land. Sure, it’s possible; sometimes it’ll happen. But being aware of that percentage allows you to decide more intelligent ahead of time. No longer do you wonder whether the deck is stacked against you, now you know how many cards you should of expect to look at before you get what you want.
When you change that mentality, when you move away from blindly hoping things go well, then you’re no longer relying on luck; instead you’re creating wins through careful draws.