🎲 Dry Streak Probability Calculator
Measure how unlikely a no-drop streak is, how many attempts match a target confidence, and how pity changes the odds of still being dry.
Still-dry odds using the same effective flat rate.
Still-dry odds after soft pity ramp and hard pity settings.
How dry the same streak looks if the real rate is worse.
How suspicious the streak looks if bonuses make the rate higher.
| Milestone | Attempts | Still dry | Drop by then | Read |
|---|
| Confidence | Total attempts | Attempts from now | Still dry at target | Time from now |
|---|
| Drop rate | Expected attempts | 50% drop by | 90% drop by | 95% drop by | Dry after 100 |
|---|
| Next attempts | Total dry count | Still dry after session | Drop during session | Farm time |
|---|
The drop rate was one percent. That’s reasonable. But maybe you didn’t get it after two hundred tries, or even four hundred. Maybe you’re thinking something is wrong with the game, the odds were changed on you, or you’re cursed. Often, it’s simply normal variance.
Look at math on the dry streak calculator to understand how those numbers can work out like they do. It doesn’t matter what happens; it matters why it happened. A one percent drop rate is misunderstood by most people. They believe that means they’ll get it on try number one-hundred. It’s a naturaly trap to fall into.
Why Math Helps With Bad Luck
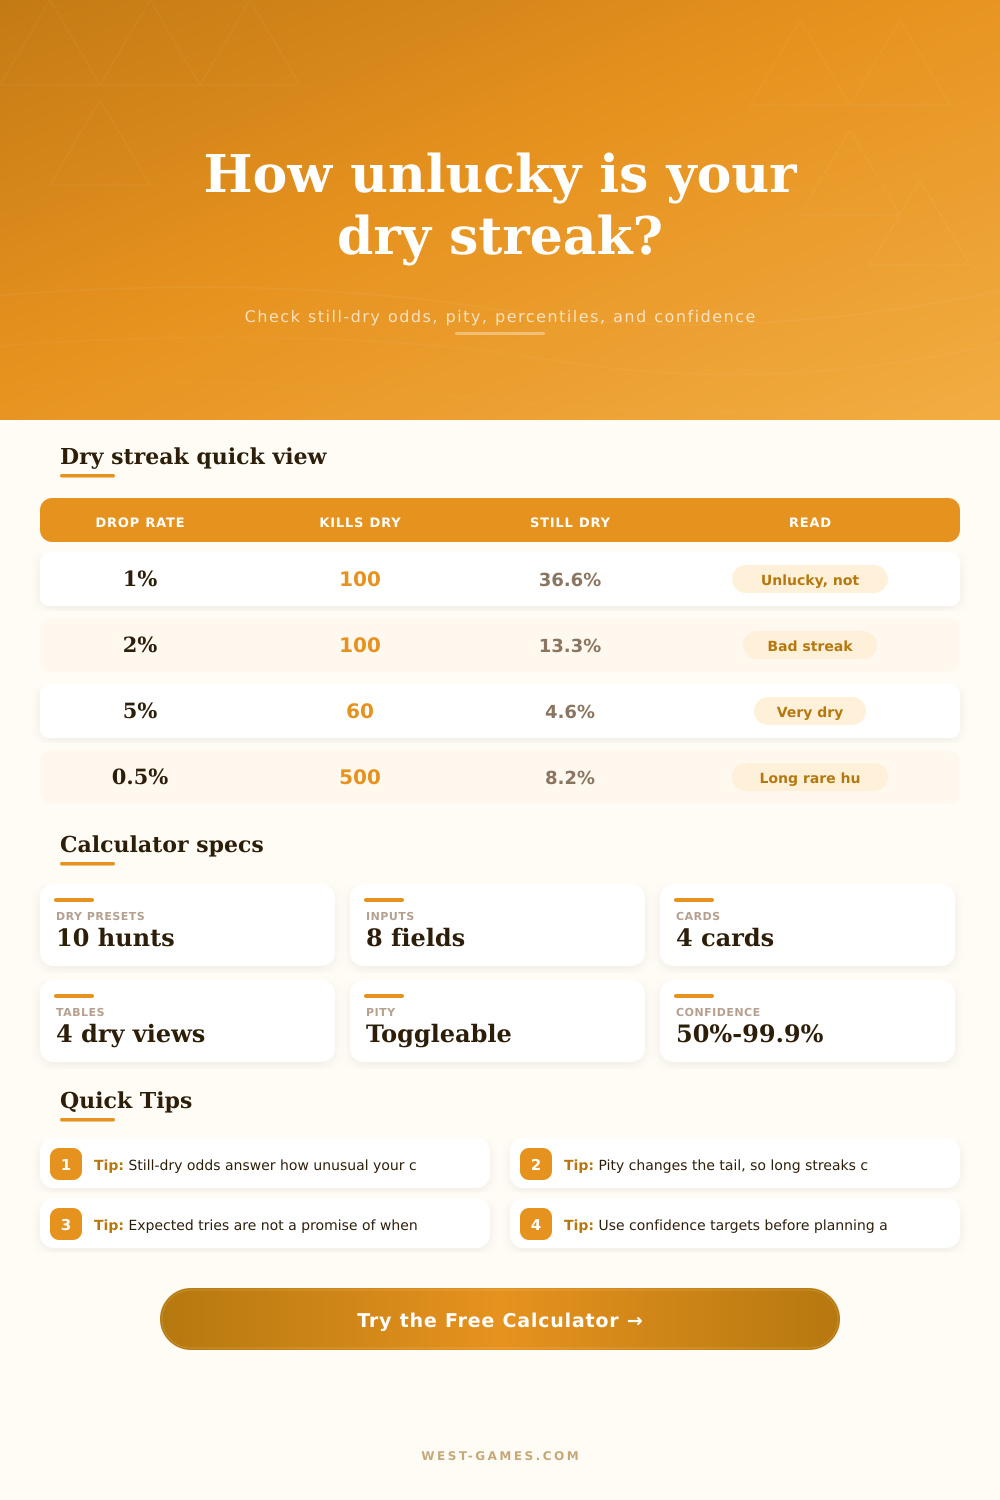
But probability isn’t like a vending machine. It behave according to an exponential decay curve. That means that after one-hundred tries, you’re going to end up with nothing still, about thirty-six point six percent of the time. That might feel unlucky, but it isn’t actualy unfair. But it’s also statistically normal.
You can use the calculator to understand that you are within the expected range just following a streak. And this is why inputs matter: these are the ways contemporary games deals with randomness. Rate ramps and pity systems is in many games. The more you fail, the better your chances become. To have any idea what’s going on, you must enter those pity thresholds into the tool.
Without knowing those, the tool treat everything as separate trial. That’s not so forgiving. Setting the hard cap and soft pity start correctly change the tail of the distribution significantly. It flips it from a long grind into a bounded wait with a guaranteed floor.
So: What about confidence targets? How do you plan out your sessions based off them? Well, you want to make 95% certain? That requires many more tries than the average case suggest. The confidence target is different then the expected value. The expected value is the mean, but the confidence target is what it takes to feel certain.
That’s key in terms of time management. You may not achieve high confidence on a rare drop if you have only two hours this weekend. That tool converts these abstract percentages into an estimate of both number of attempts required and amount of time they’ll take on the farm. It guides you towards knowing when to save your energy for another day, or to push through.
Streaks, too, have a psychological component that any formula will miss. We’re programmed to see patterns where there are none. Humans is bad at recognizing randomness because we look for patterns where none exist. What looks like someone rigging the deck, a brief period of good luck and then a long drought; might simply be an example of our bias towards randomness.
The percentile result compares you to other players. If you’re in the ninety-ninth percentile of dryness, then only one percent of folks has been waiting longer than you have. It confirms your feeling but doesn’t confirm your suspicions: this isn’t some kind of rigged odds system. It reminds you how long you’ve been on a hunt so you don’t lose your mind.
The comparison grid also makes it clear that results are very sensitive to rates. A streak that looks extremely rare if you get twice as many drops from bonuses starts to look less rare when you assume the base drop rate is only half of what’s advertised. Sensitivity analysis allow you to stress test your assumptions. Maybe a game’s pity system doesn’t use the mechanics you suspect.
That’s fine, you can still run through best case and worst case scenarios to come up with a range you could of worked with. In the end, however, that’s what it comes down to: Luck is simply the accumulation of probability. Your emotions have nothing to do with the math, but math has everything to do with helping you understand what the hell’s going on.
No more guesswork: Do I keep going? Do I quit? How much risk am I taking at this point? The tool removes the emotional component; all that remains are the numbers. And they tell you precisely how many times more you must try before you can reach whatever level of confidence you’re aiming for. Whether you’re after that raid exotic, or that gacha character, you’ll know your chances.
And that way you can set your expectations accordingly. Go into it with your eyes open, prepared to grind, and equipped with a realistic timeframe for success. The streak may still be long but never again will it seem like a mystery.