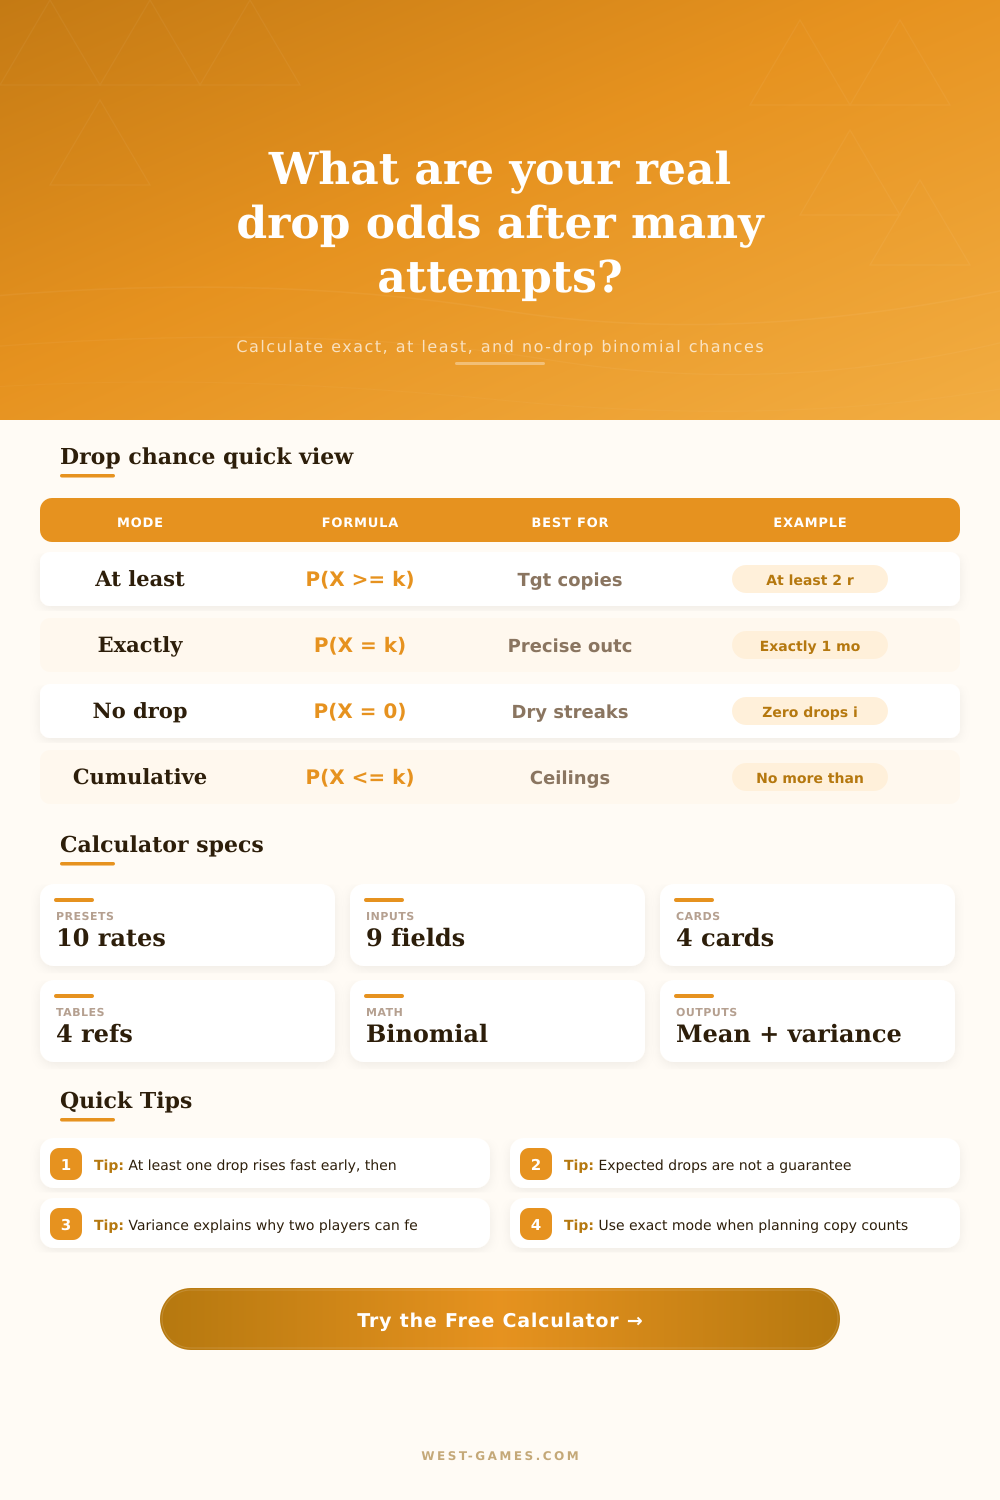
Binomial Drop Chance Calculator
Estimate exact drop counts, at least one success, no-drop streaks, cumulative probability, expected drops, variance, and farming pace from a fixed per-attempt drop rate.
How to read it: the model assumes every attempt has the same independent chance after your boost. Use it for loot tables without pity, changing odds, or guaranteed bad-luck protection.
Probability Breakdown
Farm Planning
| Attempts | No drop | At least one | Expected drops | Farm time |
|---|
| Drops | Exactly this many | At least this many | At most this many | Read |
|---|
| Target drops | Exact chance | At least chance | Expected gap | Planning use |
|---|
| Preset | Base rate | Attempts | Mode | Common use |
|---|---|---|---|---|
| 1% Mount Hunt | 1% | 100 | At least 1 | MMO mounts and cosmetics |
| 0.5% Raid Exotic | 0.5% | 200 | At least 1 | Weekly raid clears |
| 2% Boss Unique | 2% | 80 | At least 2 | ARPG boss farming |
| 5% Event Token | 5% | 40 | Exactly 3 | Limited event loot |
| 10% Dungeon Rare | 10% | 20 | No drop | Dry-streak checks |
| 0.1% World Drop | 0.1% | 1000 | At least 1 | Ultra-rare open-world loot |
| 12.5% Relic Part | 12.5% | 16 | Cumulative up to 2 | Reward pool splits |
| 25% Craft Proc | 25% | 10 | At least 4 | Crafting upgrades |
Current Plan
Your current attempts and adjusted rate.
Double Attempts
Same rate, twice the attempts.
Boosted Rate
Same attempts with an extra 25% rate boost.
Target Confidence
Attempts needed for your confidence setting.
Defeat the boss. Check your inventory. There is nothing. You beat the boss again. Again. And again. Somewhere along the way, the math no longer feels like part of the game. It begin to feel like a personal affront. Is the system rigged? Are you simply unlucky? More often then not, the answer is something simpler. Probability are behaving as intended.
To understand drops it’s important to rethink concept of averages. When most people play games, their gut feeling suggest that expected drops are promises. They’ll read that an item drop at a one percent rate, then assume that if they kill one-hundred thing, they should get it. That’s not true. Once you enter the base rate and how many times you’ve tried to obtain something, calculator does the rest.
Why You Don’t Get Rare Drops
You don’t have to do any dodgy mental math; it just shows your chances for this specific run versus what an average player see over time. This difference is glaring in variance section of the tool. Variance refer to how wide your results stray around that average. It’s huge in low probability situations. Your expected value might be one drop but your likelihood of recieveing no drops at all is 50%.
And that’s what they miss. People conflate the mean with the mode. The mean describes where middle of the bell curve sits. The mode describe which result is the most probable. For rare drops, those two numbers are frequently miles apart from each other.
The probability modes are where it’s important to choose correctly. Cumulative chance is what you should of look at if you’re trying to plan out how many of an item you’ll need to farm up to make something. That way you can set reasonable expectations about how high your ceiling might be. What are your chances of being below some number?
That’s good for managing resources if you’re looking to do a run but don’t want to grind blind. Or maybe you simply want to know “how long will I have to keep grinding until there’s a 90% chance I get at least one copy of this?” In that case, it tells you that straight-up without having to grind around guessing so you can see when what you expect starts happening in real life.
But mathematically speaking: dry streaks follows a predictable pattern. They’re psychologically brutal, but they aren’t evidence of faulty code. Oftentimes, it’s simply the long tail of a bell curve. You can sanity-check these runs in the calculator’s no-drop mode. This give you a sense that while the odds may have been decent, still going fifty tries without single hit wasn’t so uncommon after all.
This makes it easier to see that how you feel doesn’t match the actual numbers. Rage-quitting becomes harder to do.
Finally, plan out what it will cost to try to get it on your farm. This one let you enter in how much it’ll cost you in currency (or stamina) to do so. That turns unclear odds into real-world resource management. Sure, you might think you’ve got a sixty percent shot at something, but that doesn’t help if every time you try it burn up your day’s supply of stamina. Cost plus probability equals real efficiency. Does that boss reward you well for the effort? Or are those enemies you’re farming a good use of your resources?
Event bonuses and gear boosts changes the base rate. These don’t alter randomness though. A ten percent boost will increase your chance of success, but doesn’t mean you’re guaranteed anything. The calculator take these into account automatically. It doesn’t let the chance go higher than one-hundred-percent, so it never gives you an impossibility. That keeps it valid if you want to stack lots of luck bonuses.
Common gaming situations is also given context through reference tables provided on the page. It illustrates what different drop rates mean over multiple attempts. This allows you to see how you compare to typical benchmarks. What it’s like farming an item with a twenty-five percent drop rate compared to farming something with a zero-point-five percent one? It isn’t linear, no. It’s exponential in terms of patience and time required.
In the end, it comes down to perspective and patience. Playing against random number generation can be frustrating. These tools take away some of the magic that game design builds in. They remove the sense of controlling something through your choices, it removes hope for something we know data on.
Want to finish a crafting chain? Want a rare mount? Understanding how things work help you make more informed decisions. It lets you play by the system’s rules instead of struggling against them. Eventually, they’ll drop. Half the battle is knowing when.