🎮 0.1% Low FPS Calculator
Calculate average FPS, 1% low, 0.1% low, frametime milliseconds, stutter spikes, benchmark run length confidence, smoothness percentile, and CPU or GPU bottleneck hints.
0.1% low compared with the average FPS.
Stutter spikes per benchmark minute.
Share of frames under the refresh frame budget.
CPU and GPU load hint based on utilization and lows.
| Metric | How it is calculated | Best use | Watch for |
|---|---|---|---|
| Average FPS | 1000 divided by mean frametime | Throughput and settings comparison | Can hide stutter |
| 1% low | Average of slowest 1% of frames | General smoothness floor | Needs enough samples |
| 0.1% low | Average of slowest 0.1% of frames | Hitch and traversal stutter checks | Sensitive to short runs |
| Minimum FPS | Single slowest instant frame | Finding a worst outlier | Too noisy alone |
| 99.9th ms | Frametime at the slow 0.1% edge | Frame delivery analysis | Higher ms means worse pacing |
| Run length | Approx frames at 120 FPS | 0.1% sample count | Confidence |
|---|---|---|---|
| 10 seconds | 1,200 frames | 2 frames | Useful only for quick checks |
| 30 seconds | 3,600 frames | 4 frames | Fair for repeatable benchmark loops |
| 60 seconds | 7,200 frames | 8 frames | Good for most gaming captures |
| 120 seconds | 14,400 frames | 15 frames | Strong for open-world traversal |
| 300 seconds | 36,000 frames | 36 frames | Excellent for rare hitch hunting |
| Target | Frame budget | Good 1% low | Good 0.1% low |
|---|---|---|---|
| 60 FPS | 16.67 ms | 50 FPS or higher | 45 FPS or higher |
| 90 FPS | 11.11 ms | 75 FPS or higher | 65 FPS or higher |
| 120 FPS | 8.33 ms | 100 FPS or higher | 85 FPS or higher |
| 144 FPS | 6.94 ms | 115 FPS or higher | 100 FPS or higher |
| 240 FPS | 4.17 ms | 190 FPS or higher | 165 FPS or higher |
| Pattern | Likely limiter | FPS low clue | Practical read |
|---|---|---|---|
| GPU 95-99%, CPU below 85% | GPU bound | Average and lows move together | Lower resolution, RT, shadows, or upscaling load |
| CPU 85%+, GPU below 90% | CPU bound | 1% low drops harder than average | Reduce crowd, simulation, draw distance, or background load |
| Both high | Balanced limit | Settings changes may trade one limiter for another | Watch frametime while changing one setting |
| Sudden rare spikes | Stutter source | 0.1% low collapses | Shader compile, streaming, storage, overlay, or driver issue |
| Stable cap with high lows | Frame cap bound | Low ratios stay close to average | Cap is doing its job |
| Preset | Average target | Run length | Load pattern | Main low-FPS lesson |
|---|---|---|---|---|
| 1080p Competitive FPS | 240 FPS | 60 seconds | High CPU, high refresh | Micro-jitter matters because each frame budget is tiny. |
| 1440p Ultra GPU Load | 118 FPS | 90 seconds | GPU saturated | Lows often scale with graphics settings and render resolution. |
| Open-World Traversal | 96 FPS | 120 seconds | Streaming variance | 0.1% low reveals traversal hitches better than average FPS. |
| Shader Compile Spikes | 110 FPS | 90 seconds | Rare big spikes | A few huge frames can crush 0.1% low while average stays fine. |
| Handheld 40 FPS Cap | 40 FPS | 60 seconds | Stable capped frame delivery | Even frametime can feel good despite lower average FPS. |
Percentile results are most useful when the benchmark route, run length, background applications, and display mode stay consistent between tests.
You’re playing a game on a high refresh rate monitor, sitting in a dark room waiting for the next frame. On screen the average frames per second looks respectable, and your hardware seem to be doing its job. Then, mid-combat, the camera swivels slightly, and everything stutters, just for a fraction of a second. If you don’t pay attention, you might ignore that. But it’s jarring enough to make something feel wrong. And that micro-stutter isnt usually about average performance. It nearly always hides in lowest percentiles of your frametime data.
This 0.1% low FPS calculator turns gaming benchmark samples into average FPS and low percentiles. It also shows frametime spikes, smoothness confidence, and bottleneck hints.
Why Average FPS Is Not Enough for Smooth Gaming
The mean, that’s what most gamers obsess about. It’s an easy number to compare against their friends. But averages tells only part of the story; they lie by omission. Sure, you may spend ninety nine percent of your time at one hundred frames per second, but you might drop to ten frames during a texture streaming event. The average still looks fine, but it feels broken.
Plug in your variance settings and run length, and the tool above will handle the math for you, saving you from guessing whether that hitch was a systemic failure or a statistical outlier. Understanding this difference help with troubleshooting. To get something you can use, though, you need to record for a while and have plenty of frames. It’s fine to check things quickly with a short ten second clip. However, you won’t see rare hitches because they don’t happen often enough to calculate a meaningful zero point one percentile. For this reason, you should of aim to record for at least sixty seconds, ideally more; to ensure those slow parts (like shader compilation events or time spent in loading zones) will show up in the recorded data set. This frame count informs the calculator how many frames constitutes that bottom tenth of a percent, which greatly influences the accuracy of your results. If you don’t have enough, then that lowest number might not represent anything more than random noise on your system.
Imagine frametime as the budget per frame. You have about sixteen milliseconds at sixty hertz to get each frame done, otherwise it’s too late. If it takes longer then that, let’s say it takes twenty milliseconds, then you didn’t make your budget; you’ve missed a frame. This results in a stutter.
You can use the tool’s inputs for scene variance and micro jitter to see how much your work load varies due to background processes or camera movement. Usually if there’s high CPU usage plus low GPU usage, it means you’re running into a bottleneck. Not having your processor be able to pump out frames quickly enough for the graphics card to display them. When both are at around one hundred percent usage, it indicate the system is well balanced but completely maxed out, and anything else put on it will cause performance to drop. A common mistake is for people to blame their graphics card, but it’s usually caused by storage speed or other background apps stealing cycles from CPU.
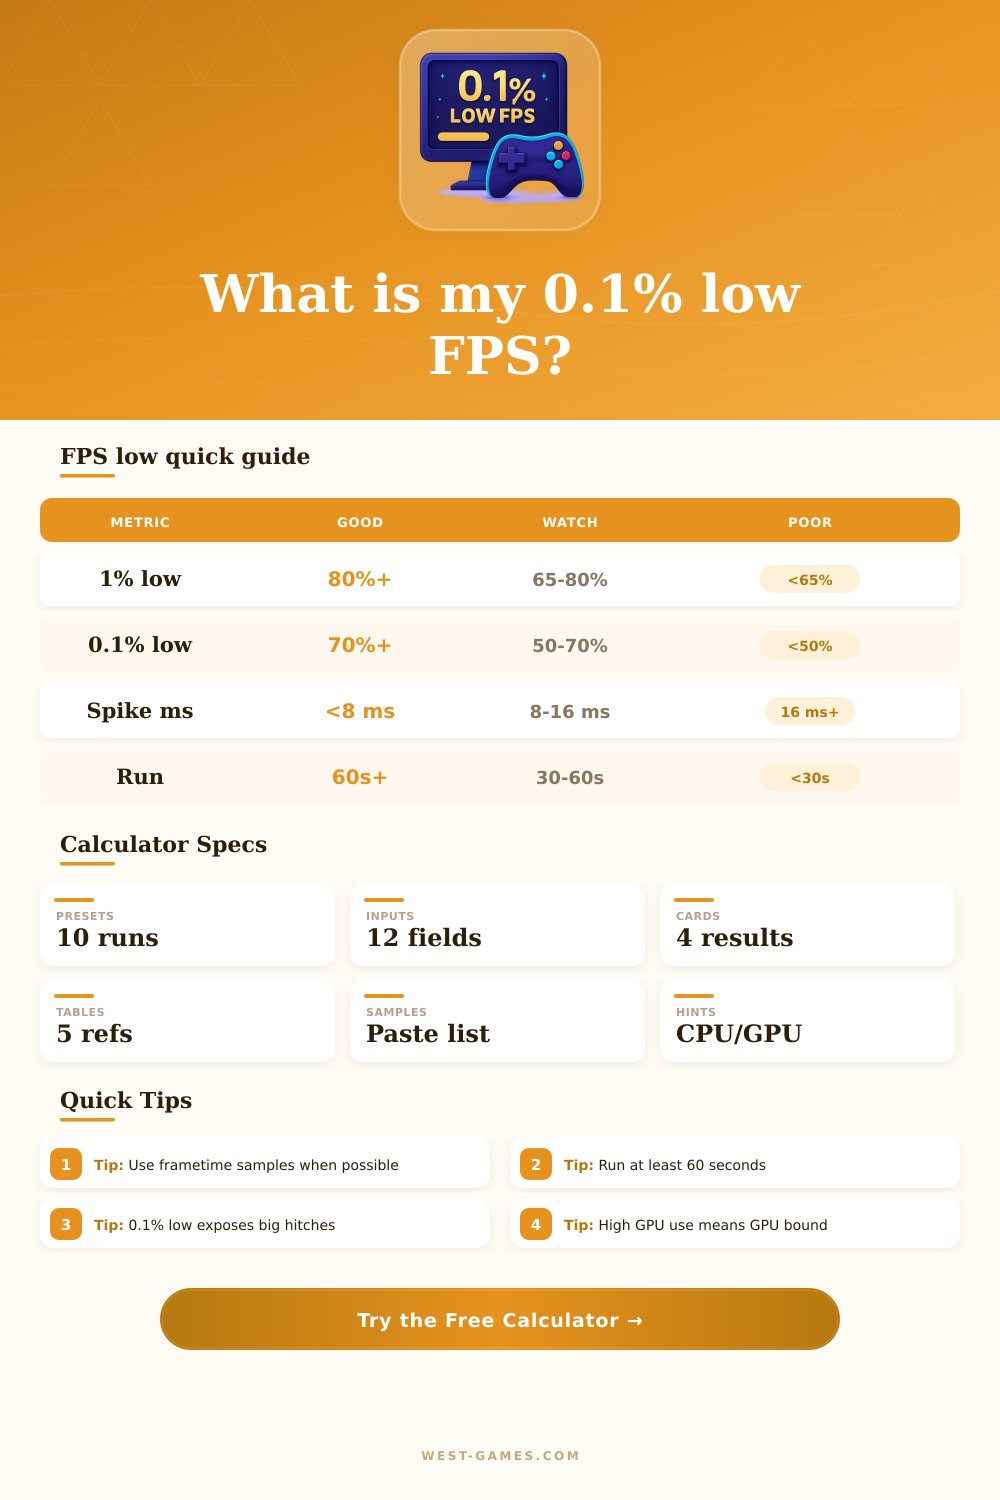
The calculator comes equipped with sample reference tables to make this easy to understand by providing clear thresholds for smooth performance based off refresh rate. Competitive players should aim to have a one percent low that remains over eighty percent of their average fps as a good rule of thumb. If it is less than half of your average, you are probably experiencing some pretty bad hitches that can’t be solved with overclocks alone. You need to change something about your system or settings.
To distinguish what’s transient and what’s persistent, it helps to run several tests. You could get unlucky with one run that captures some sort of spike triggered by something like a Windows update kicking off in the background. If you run the same route again once the shaders is cooked, you’ll start to see if there are any performance hiccups that persist over time. It’s less about driving for the biggest number possible, as much as reducing the spread on frame-to-frame performance. We can detect gradual increases or decreases in draw distance and resolution, but our eyes is much more sensitive to abrupt changes in pace.
So the bottom line is: Optimize for smoothness. Which is to say, guard the low percentiles from caving in when things get rough. Don’t focus on the sexy average stats; instead concentrate on keeping the frames coming reliable over time. Adding RAM to relieve a storage bottleneck, tweaking something else to cut down CPU load, whatever it is, you’re doing the same thing. You are protecting your frame delivery from those infrequent but damaging spikes. Keep the lows high, keep the budget tight, and match the rhythm of what is being displayed, not pursuing sheer throughput, but matching the rhythm of the display.