Pit Stop Strategy Calculator
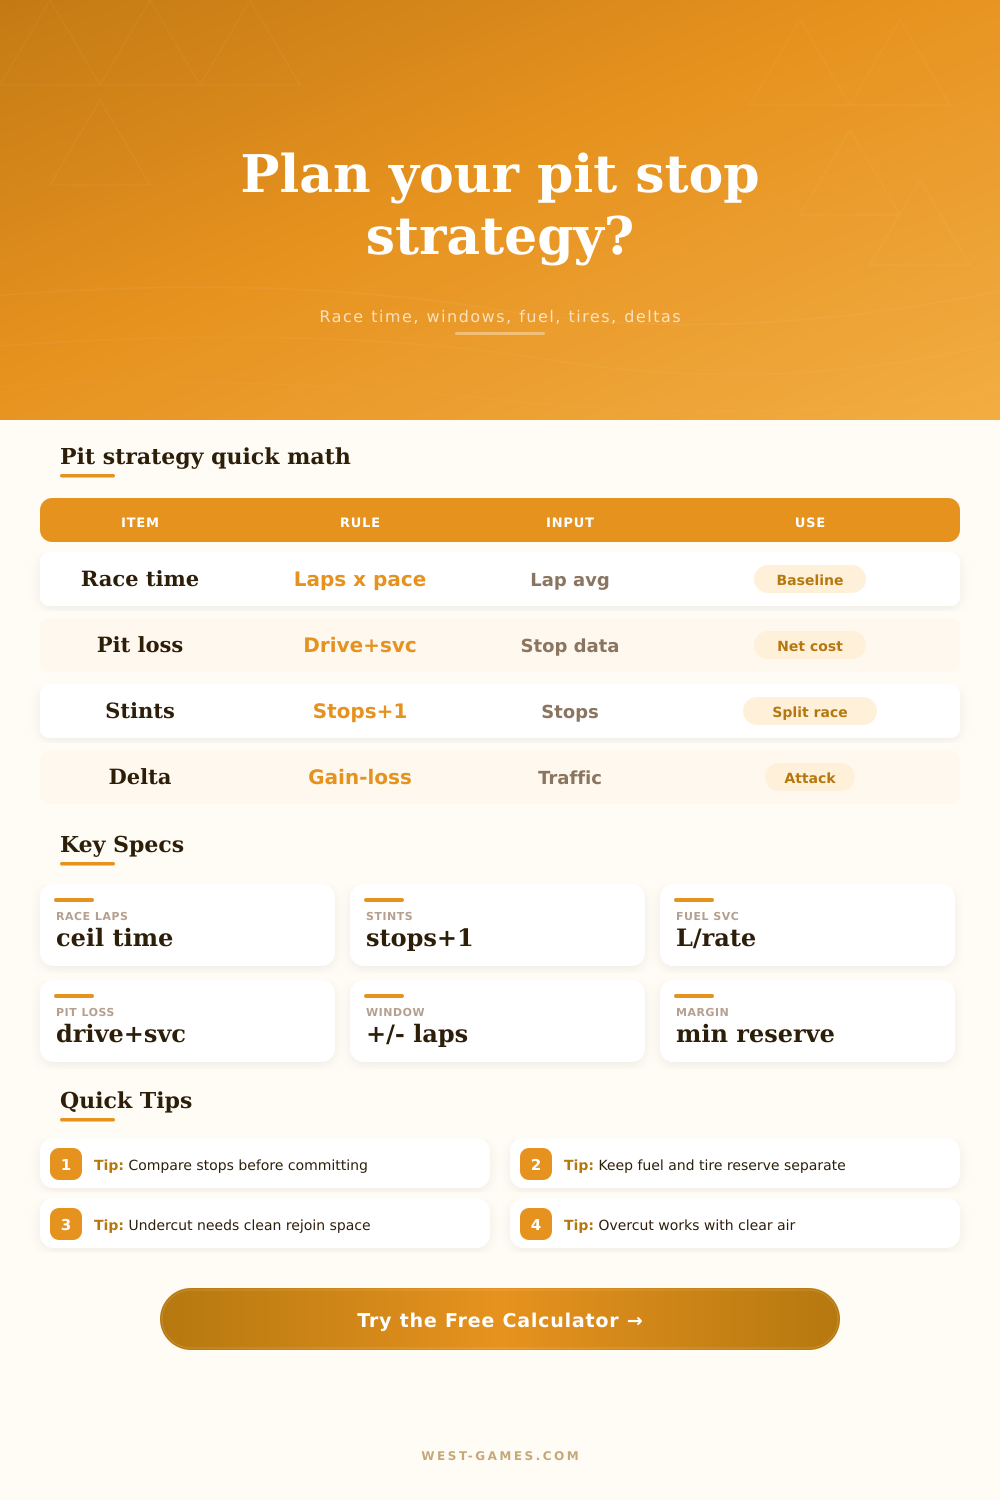
Compare stop counts, pit lane loss, tire and fuel service time, stint length, undercut or overcut delta, stop windows, and safety margin for sim racing strategy calls.
Calculation Breakdown
| Stops | Stints | Avg stint | Pit loss | Deg loss | Fuel OK | Tire OK | Total time |
|---|
The comparison uses the same total race time formula for each stop count, so changing fuel, tire, or pit lane inputs updates every row.
| Stop | Ideal lap | Earliest | Latest | Fuel margin | Tire margin | Call note |
|---|
| Move | Gain source | Loss source | Net delta | Best use |
|---|
| Preset | Format | Pace | Stops | Fuel/lap | Tire plan | Strategy focus |
|---|
A sim racer learns when it’s time to pull in. Are you half a second behind leader? Are your tires balding? Your tank empty? Is there time to exit pit road before they wear out? Or should you come in now for a few seconds to get new ones and pick up some time? It’s not just about driving fast. It’s about knowing when to hit the brakes.
While most racers view the pit stop as something to avoid, a penalty to be paid, smart racers use them as a way to gain track position. Its making a stop a net positive. Here’s how: Instead of focusing on lap times, focus on total cost of each pit stop. How much will all those stops adds up?
How to Win with Smart Pit Stops
Fortunately, the math is complicated for you, with our calculator here. It takes in degradation curves, service times, and lap time. But it won’t matter unless you know what those numbers mean on the track. Plug in your projected stops and average lap time, and it break down the race into stints. Those stint show you just how far you’re going to run on each set of tires. And that’s key to managing them.
Running 20 laps on soft compound, most drivers can expects to lose a full second of speed by the end of the stint. A tenth-per-lap doesn’t sound like much (but after ten laps), you’ve given away a whole second.
A lot of folks gets hung up on gas. “If I fill it up, then I’ll make it.” That is true. But now you have all that extra gas slowing you down around every turn. The calculator adjusts for that by measuring how long it takes to carry all that weight versus how much you are saving by not stopping. There’s a tipping point, a sweet spot… Where the weight of all that gasoline finally overcomes the benefit of not having to stop. That means checking both your tank size and the rate of fuel delivery at the stop.
If you can fuel slowly enough in the course of your game/series, you may find that staying out a little longer is faster then two rapid refuels. It becomes a balancing act between aerodynamics (drag) vs. Mechanical service takes time.
And then there’s the chess game against fellow drivers. A staple is the undercut, where you pit before your competitor to get clean air and new rubber. However, if you don’t return to the fight with the track clear, you lose any advantage you gained. You pitted early, now you’re held up by slower cars; bad news. The calculator addresses this by allowing you to specify undercut windows and traffic penalties. Does the reward (new tires) outweighs the risk (getting stuck)?
Conversely, the overcut is the play of staying out past your opponent. It require faith in how long your old tires will last as well as benefit of clear air. Overcutting is a high-risk/high-reward strategy requiring confidence in your race pace. This is where strategies come to die.
This is your safety margin. This is what it thinks you have in tires and fuel. A strategy is not good if it leave you with just enough fuel to cross the finish line. You should of know that you have enough fuel to also account for traffic jams, safety cars, etc. The page lays out these windows in reference tables. These tell you the earliest and latest laps for each stop. Gamble everything on the last lap and drive a two-wheeled car? Or pit a lap earlier than needed but feel secure about having a cushion?
At the end of the day, sim racing is an information game. Knowing how much fuel weighs, how tires will decay over time, or what the cost of entering the pit lane is give you a huge advantage. Don’t worry about being a math wiz, though. Simply equip yourself with the proper tool. This calculator does all the hard work so that you can concentrate on making the decisions. Plug in your numbers, review your options and go back to driving. Not every fast line goes through the corner. Sometimes it’s the one going into the pits.