Flight Sim Ground Speed Calculator
Plan realistic simulator legs from true airspeed, course, wind direction, wind speed, distance, fuel flow, reserve fuel, and time compression.
Calculation Breakdown
| Aircraft profile | Typical cruise TAS | Typical fuel flow | Use in the calculator |
|---|---|---|---|
| Cessna 172 Skyhawk | 110 to 125 kt | 8 to 10 gal/hr piston fuel | Short VFR routes, pattern-to-pattern hops, slow sightseeing legs. |
| Bonanza G36 | 165 to 180 kt | 14 to 17 gal/hr piston fuel | Fast GA cross-country flights where winds change ETE noticeably. |
| TBM 930 | 300 to 325 kt | 320 to 390 lb/hr turbine fuel | IFR turboprop routes with meaningful winds aloft and reserve planning. |
| Citation CJ4 | 410 to 440 kt | 1200 to 1500 lb/hr jet fuel | Business jet legs where headwinds can add large fuel reserves. |
| A320neo / 737-800 | 440 to 465 kt | 5000 to 6200 lb/hr jet fuel | Airliner sector planning, virtual airline dispatch, and block timing. |
| 787-10 / A350-900 | 485 to 505 kt | 11000 to 12500 lb/hr jet fuel | Long-haul sim flights where jetstream headwind or tailwind dominates ETE. |
| Wind angle from course | Headwind component | Crosswind component | Ground speed effect |
|---|---|---|---|
| 0 degrees from ahead | 100% of wind speed | 0% of wind speed | Subtracts almost directly from TAS. |
| 30 degrees off nose | 87% of wind speed | 50% of wind speed | Mostly slows the route, small crab correction. |
| 45 degrees off nose | 71% of wind speed | 71% of wind speed | Strong time penalty and noticeable heading correction. |
| 90 degrees abeam | 0% headwind | 100% crosswind | Little direct push, but crab reduces along-track speed. |
| 150 degrees aft | 87% tailwind | 50% crosswind | Major ground speed boost with manageable correction. |
| 180 degrees from behind | 100% tailwind | 0% crosswind | Adds almost directly to TAS. |
| Quantity | Aviation unit | Metric or statute equivalent | Planning note |
|---|---|---|---|
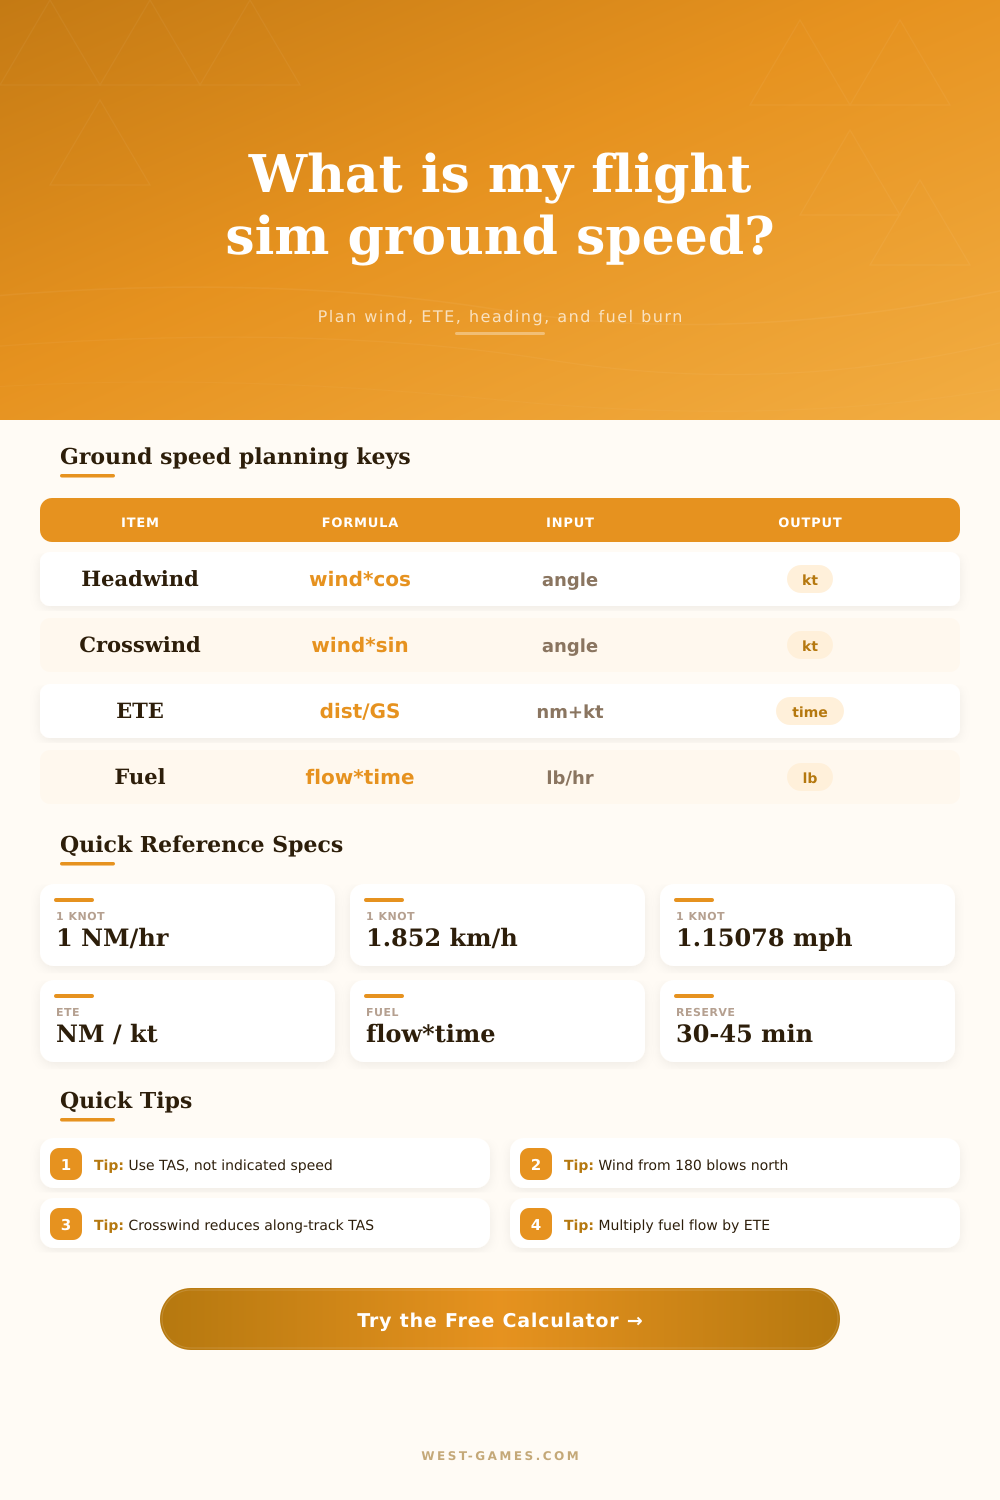
| Speed | 1 knot | 1.852 km/h or 1.15078 mph | Knots are nautical miles per hour, so NM / kt gives hours. |
| Distance | 1 nautical mile | 1.852 km or 1.15078 statute miles | Most sim flight plans and nav logs show route legs in NM. |
| Fuel mass | 1 pound | 0.453592 kilogram | Jet aircraft commonly plan fuel by mass in pounds or kilograms. |
| Avgas volume | 1 US gallon | About 6 lb avgas, 3.785 L | Small piston aircraft often list fuel flow as gallons per hour. |
| Jet fuel volume | 1 US gallon | About 6.7 lb Jet A, 3.785 L | Use mass from your simulator when possible for airliner dispatch. |
| Time compression | Sim rate multiplier | ETE / sim rate | Fuel burn still follows simulated time, not your real clock time. |
| Check | Calculation trigger | Good sim habit | Why it matters |
|---|---|---|---|
| Crosswind too strong | Crosswind approaches TAS | Pick a lower wind layer or change route altitude. | The wind triangle cannot hold course if crosswind exceeds available TAS. |
| Large crab angle | Wind correction above 10 degrees | Check autopilot heading, LNAV behavior, and arrival intercepts. | Large drift corrections can surprise visual approaches and VFR nav legs. |
| Fuel tight after reserve | Remaining fuel below zero | Add fuel, reduce cruise speed, choose a closer alternate, or change altitude. | Headwinds increase time, and fuel burn depends on time aloft. |
| Time compression mismatch | High sim rate selected | Watch descent planning and fuel state before leaving cruise. | At 8x or 16x, route time disappears faster than workload feels. |
In the simulator, flying in ground speed is a matter of life and death. That sweet flight plan from New York to Boston is just fine until you hit that headwind over the ocean. Your estimated time of arrival slip away. Your fuel margin looks slim. Will you make it to the alternate? Or did you run out of gas?
It’s all about how fast the airplane flies over the ground; not necessarily through the air. When conditions impact your track, your ground speed shift. After inputting both wind information and your true airspeed, the calculator perform the vector math for you. No more wondering whether a forty-knot wind at a thirty-degree angle is helping or hurting you.
Why You Need a Ground Speed Calculator
While most pilots realize that a headwind slows them down while a tailwind speeds them up, the tricky component come in the form of the crosswind. A crosswind doesn’t go straight back or forward; instead, it pushes you to the side, making you crab into the wind, thereby taking away some of your forward momentum. That’s where folks gets tripped up. Sure, you may have an awesome tailwind on paper, but due to pointing the nose into the drift, you burn fuel pointing yourself into the wind and you might see your ground speed decrease anyway. The tool displays how much the drift will cost you in terms of along-track speed and wind correction angle so you’ll be able to measure exactly the amount of time spent drifting.
The best aircraft profile makes a difference. Because performance curves are non-linear, a headwind of thirty knots will cost a Cessna 172 a significant portion of its cruise speed. What was an hour’s flight becomes a two-hour slog requiring double the fuel. That same headwind is just a fraction of the velocity of a much faster-moving Boeing 787, and the big plane hardly even feels it. You don’t need to find the burn rate for each leg; the calculator does that for you as part of the ratio adjustments. With typical data for popular sim aircraft from light piston planes all the way up to heavy jets, default values provide a realistic starting point for fuel calculations. Turboprops, especially, is less tolerant of wind changes than jets and your fuel plans should reflect this greater sensitivity.
In a simulator, fuel planning can be an after-thought. It’s either something you forget about or just kind of assume that everything will work out fine since your fuel gets topped off every flight. But fuel planning makes or breaks your flight. Do you have enough for taxi? Climb? Cruise? Descent? Reserve? Every minute you spend in one phase versus another affect how much time you’ll burn during the flight. The calculator includes reserve time into your total block time so you don’t plan on landing with no fuel left in the tanks. Also, it accounts for the time compression built into simulator software. You may only see twenty minutes of flight time for a trans-Atlantic trip on your real-world clock because you are flying sixteen times faster than normal. However, that doesn’t mean the plane isn’t burning gas as if it were up there for sixteen hours. Many people get confused between sim time vs real time and end up in unexpected fuel states.
On the page, there is some reference tables that help you visualize the effects of various wind angles. For example, it isn’t naturaly good to have a wind right from behind you or even just a little bit off center. A tailwind along with a really strong crosswind component will require a correction that can offset the gain in speed. You may be able to get up into that jetstream and catch more speed climbing high, but then you also run the risk of losing engine efficiency because of the colder air. Or maybe you need to drop down low to conserve fuel and then you hit those stronger headwinds at the lower level that eat away at any savings you gained. There is no magic answer, just better guesses.
“Simulator flying is all about understanding the physics of what you’re piloting. The limits imposed upon you up in the air are the ones you’ve chosen via the inputs. If it’s an airliner over the ocean or a bush plane trying to make it through a mountain pass, the wind doesn’t give a crap about your schedule. Understanding the wind, accounting for it, and allowing yourself a safety margin is what distinguishes the pro pilot from the casual flier. Because you value the factors beyond your control, you’d of liked to land with a little gas in your tank. Before taking off, the numbers on that screen aren’t gospel but they are the best you’ve got.”