iRacing iRating Gain Calculator
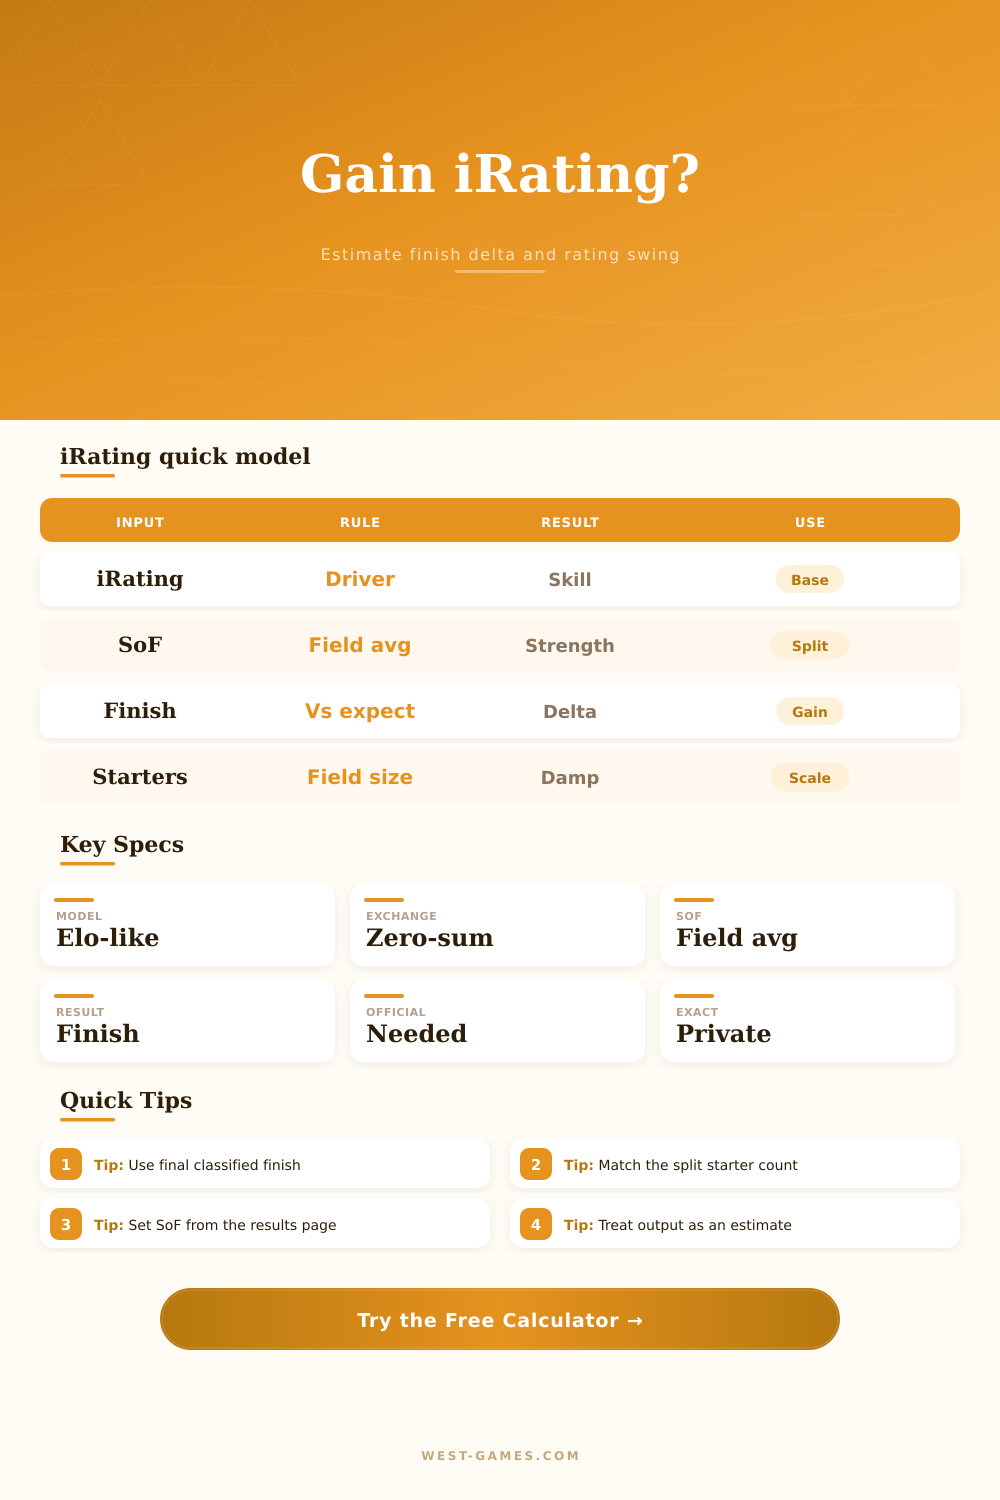
Estimate an iRating change from your rating, field strength, starter count, split shape, finish position, and expected finish. This is an estimator because the exact iRacing formula is not public.
Calculation Breakdown
| Preset | Category | Your iR | SoF | Starters | Finish | Split shape | Use case |
|---|
Preset values are editable examples. They are not official iRacing results or guaranteed rating changes.
| Concept | Public meaning | Calculator input | Estimator treatment | Limit |
|---|---|---|---|---|
| iRating | Skill and proficiency measure | Your starting iRating | Baseline rating for pairwise expectations | Separate by category |
| Official race | Ranked event with enough competitors | Race status and starter minimum | Unofficial mode returns no estimated change | Series minimum can vary |
| Field strength | Race difficulty from field ratings | SoF and spread | Builds a synthetic opponent field | Exact opponents are better |
| Expected finish | Finish above or below expectation changes iR | Finish position | Compares actual finish to rating-based expectation | Approximate only |
| Splits | Drivers grouped by iRating when entries exceed capacity | Split rating shape | Adjusts rating distribution around SoF | Registration data unknown |
| Zero-sum exchange | Points are exchanged among competitors | Zero-sum checkbox | Centers synthetic field around target SoF | Exact formula private |
| Finish band | Range | Expected score | Estimated exchange | Rating signal | Notes |
|---|
This table recalculates from the active inputs and shows how the same split can swing for different finish bands.
| Band | Opponents | Avg opponent iR | Your expected score | Modeled actual score | Exchange before damping | Exchange after damping |
|---|
Webhook row marker: index 1101, gid 1450490472. Exact iRating calculations are proprietary, so these rows are a transparent estimator model.
You spun out on lap three, and the penalty cost you ten positions on results page. The penalty costs you ten positions. Your iRating feels out of reach. Before all this happened, though, you were driving well. System just looks at final grid, that’s the disconnect between effort and reward at the heart of competitive sim racing.
It cause drivers to focus on each and every point, attempting to reverse-engineer an algorithm kept behind closed doors. The calculator aim to close that gap. It uses a clear, Elo-style model to predict how your rating change based off whether you finished better or worse then expected. It won’t tell you what the official iRacing formula is, but it will provide a frame of reference through which to understand the mathematics behind your journey.
How the Rating Calculator Works
The core mechanic is based on expectation versus reality. Your current iRating is pitted against overall average of the field, which becomes the baseline for expectation. So if you’re a 1800-point player in a field with an average of 1850, it will expect you to perform below par. Getting above expected result causes you to earn points, getting below it cause you to lose points. How large the swing is depend on how strong the opponent you bested was. You’ll get way more credit beating a 2000-point player in a 1800-point field then you will beating a 1700-point player.
Why? Because field strength is important. Field strength are the gravity of the race. This tool allow you to tweak how spread out ratings are from average. The tighter the field, the closer everyone’s skill levels will be, so beating someone is only moderately rewarding. Conversely, the wider the field, the greater gaps between players, and a top ten will reward massive gains because you performed better than those at higher ratings.
Then there is the complication of the splits. Newcomers are often confused because when a session is divided into two grid, your performance in your own split affects both your score for that part and your total score. For example, while you could wipe the floor with Split B and have an easy day, if Split A was loaded with pro-level talent, then rest of your race score will suffer relative to what you’d get on a single, consolidated grid.
Use the calculator to model the shape of those splits, ranging from a top-heavy stack to an even distribution. That’s how you know why some drivers who finished in exactly the same place end up with very different rating changes. They were fighting through a tough battle and you had an easier one. Knowing that makes it less frustrating to see someone who finished worse than you end up with more points just because they had an easier draw. It didn’t mean it was unfair. It simply meant you were battling on a different battlefield.
It also accounts for big field damping. Pairwise interactions is spread thin when there are so many people competing. Winning one car in a 50-car field isn’t the same thing as dominating a six-car club event. The model account for that scale. This ensures estimated change is statistically significant based on your results in that particular population.
It’s a minor detail, but it makes a difference if you’re trying to project things actualy over time. You have some control over how sensitive it is, but it will still fluctuate from race to race. This is good for planning purposes. Want to hit a certain level of license? How many races at what caliber do you want to run to achieve that?
In the end, however, an iRating is simply a consistency score against your peers. Over time, it filters out the noise of good luck/bad luck and mechanical failure. It provides a way to view each race, not only as won/lost, but also as a data point in a longer trend. You should of looked at more than one race. Stop looking at one race and look at the field instead. That’s a shift in perspective that changes everything.