💾 SSD Endurance TBW Calculator
Estimate SSD years to rated TBW, drive writes per day, effective NAND writes, write amplification, spare-area headroom, reserve health, and workload profile risk.
Current inputs after existing writes, reserve health, WAF, compression, and active days.
Equivalent 1 TB class drive with a mainstream 600 TBW rating.
Same capacity class, but with a doubled endurance rating for write-heavy work.
Shows the same workload with spare-area endurance credit removed.
| Preset | Typical writes | WAF | Endurance note |
|---|---|---|---|
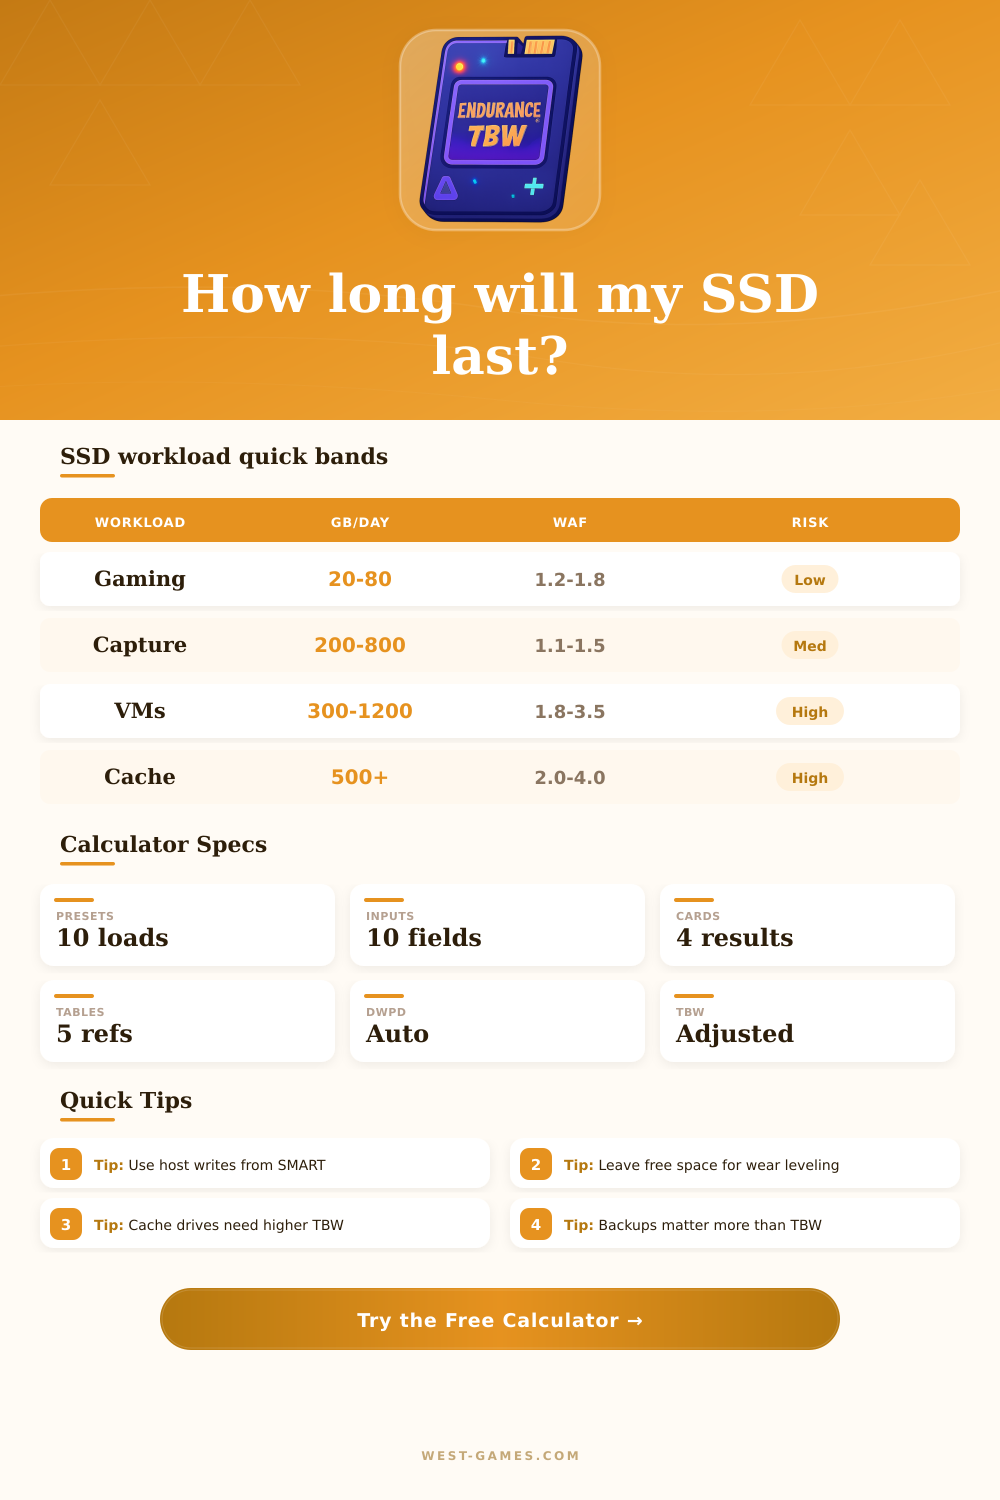
| Gaming library | 20 to 80 GB/day | 1.2 to 1.8 | Game downloads can spike, but normal play is read-heavy. |
| OS and apps | 40 to 160 GB/day | 1.4 to 2.2 | Browser cache, updates, shader cache, and page file writes vary. |
| Capture drive | 200 to 800 GB/day | 1.1 to 1.6 | Large sequential video writes are often kinder than random writes. |
| VM or database | 300 to 1500 GB/day | 1.8 to 4.0 | Small random writes need more endurance and free space. |
| DWPD | Use level | Meaning | Action |
|---|---|---|---|
| 0.02 to 0.10 | Light | Typical gaming, media, and normal desktop use. | Keep backups and monitor SMART monthly. |
| 0.10 to 0.30 | Mixed | Active desktop, creator cache, or regular downloads. | Prefer TLC and leave free space. |
| 0.30 to 1.00 | Heavy | Scratch, capture, VM, and server-style write loads. | Choose high TBW or enterprise models. |
| 1.00+ | Extreme | Full-drive writes every day or more. | Use enterprise endurance and redundancy. |
| Drive class | Typical TBW per TB | Best fit | Watch out |
|---|---|---|---|
| QLC consumer | 150 to 300 | Games, media, cold storage. | Sustained writes and tiny free-space margins. |
| TLC consumer | 500 to 700 | General gaming PC and console expansion. | Heavy scratch workloads on small drives. |
| High-end TLC | 800 to 1400 | Creator rigs, workstations, capture disks. | Thermal throttling during long writes. |
| Enterprise SSD | 2000+ | Databases, caches, VM hosts. | Check power-loss protection and write class. |
| Work pattern | Likely WAF | Why it changes | Mitigation |
|---|---|---|---|
| Large sequential writes | 1.1 to 1.5 | Controller can place data efficiently. | Keep writes batched and sustained. |
| Normal desktop mix | 1.3 to 2.2 | Updates, logs, cache, and mixed file sizes. | Leave 10% to 20% free space. |
| Random VM writes | 2.0 to 4.0 | Small updates cause garbage collection churn. | Use TRIM and avoid full disks. |
| Nearly full drive | 2.5+ | Wear leveling has fewer clean blocks. | Add spare area or move data off. |
| Example drive | Rating | 100 GB/day | 500 GB/day | 1 TB/day |
|---|---|---|---|---|
| 1 TB QLC | 250 TBW | 6.8 years | 1.4 years | 0.7 years |
| 1 TB TLC | 600 TBW | 16.4 years | 3.3 years | 1.6 years |
| 2 TB TLC | 1200 TBW | 32.9 years | 6.6 years | 3.3 years |
| 4 TB pro SSD | 3200 TBW | 87.7 years | 17.5 years | 8.8 years |
Examples use simple host writes before write amplification, reserve margins, and already-written TB. Real warranty terms and SMART counters vary by model.
You probably got a solid state drive because it’s fast. Boot up in seconds? Check. Load games quickly? Sure.
In the background, however, a clock is ticking down each time you apply an update or save a file to your solid state drive. That’s called TBW (Terabytes Written) and that’s how much data you can shove through the NAND flash before the cells reaches their end-of-life. You’ll hit 0 before you know it, which is why most folks don’t even check the specs before buying. When they do, it’s usually after seeing some kind of health warning pop up. But if you know about it now, you won’t have any panic attack later.
Understanding SSD Lifespan and TBW
This page will help you translate all those boring spec sheet numbers into real-world life expectancy for your exact configuration. The basic concept is straightforward. When you write data to your SSD, it’s etching the path for electrons into microscopic traps. After millions of cycles, these trap begin to degrade and lose their ability to hold a charge.
This endurance is rated in terms of terabytes; makers will use a standard workload as a benchmark that seldom reflect real life. What you do with the drive matters greatly. If you’re a gamer loading mostly textures, you’ll experience relatively little write stress. A video editor constantly shuffling around gigabytes of raw footage will experience much more.
To account for this, you choose a workload profile, the tool will adjust its expected write amplification based off this setting. The multiplier is write amplification. This is where write amplification comes into play. In order to accommodate saving a tiny file, your operating system may need to move lots of bigger blocks of data on the drive, because flash memory can only be written in large pages and erased in even larger blocks. When there isn’t much available space left on the drive, the controller doesn’t have as many clean block to work with, so it ends up moving more data than it should of. That’s why having some empty space not only helps things run faster, but literally extends the life of your drive!
By including this available space, the inputs let you know how much additional breathing room unused capacity provides against day-to-day churn. Then there’s the part where you think about what your SMART numbers are telling you in the first place, not just making an assumption based on the theoretical max. Your host writes should be pretty consistent across most uses and after a normal day/week/month (or whatever) you’ve got a real world number you can plug in as your average. That will give you a far better idea of what’s going on with your drive than assuming it always does its max amount of work per day.
If your drive has compression turned on, remember to account for that because some models silently compress data before storing it on the actual NAND, meaning they does less work to store the same amount of data. To help put these variables into context, the interface includes reference tables. These break out different types of drives and how they stack up to common workloads. For example, a consumer drive with QLC may well be great at cold storage, but struggle under the demands of a high workload like a scratch disk. Enterprise drives cost more because they can handle random write bursts without failing. It can help you understand whether you need to change your habits or change your hardware.
Fragmentation matters, most people underestimate its effects while overestimating how many gigabytes they can write to a drive. Thousands of small files scattered around a drive will cause far more background work for the controller than a handful of large video file. That’s not only an issue of performance, but also of longevity. The write amplification factor depends on what kind of workload you’re throwing at the drives, and if you run databases or virtual machines, that number jumps significantly, burning through your TBW allotment at a much faster rate.
In conclusion: TBW isn’t a backup plan. It provides confidence when making a purchase by helping you rule out a drive that isn’t strong enough. However, it doesn’t mean a drive won’t fail tomorrow because of a manufacturing variation, controller defect, or other hardware failure (such as a power surge). It’s a planning device. It helps you get the right-sized hardware for the job. But it doesn’t eliminate the need to have your precious files backed up somewhere else. So run the numbers, make sure you’ve got the correct equipment…then start worrying about securing the actual data.