⚡ FPS Per Watt Calculator
Calculate gaming efficiency from average FPS, 1% low, GPU board power, CPU and system watts, resolution, graphics preset, upscaling, and benchmark class.
Raw whole-system average FPS per watt from your entered benchmark.
Average FPS divided by GPU board power only for graphics tuning.
Estimated watts if you cap near target FPS while preserving lows.
Projected raw FPS/W after a mild voltage or power-limit tune.
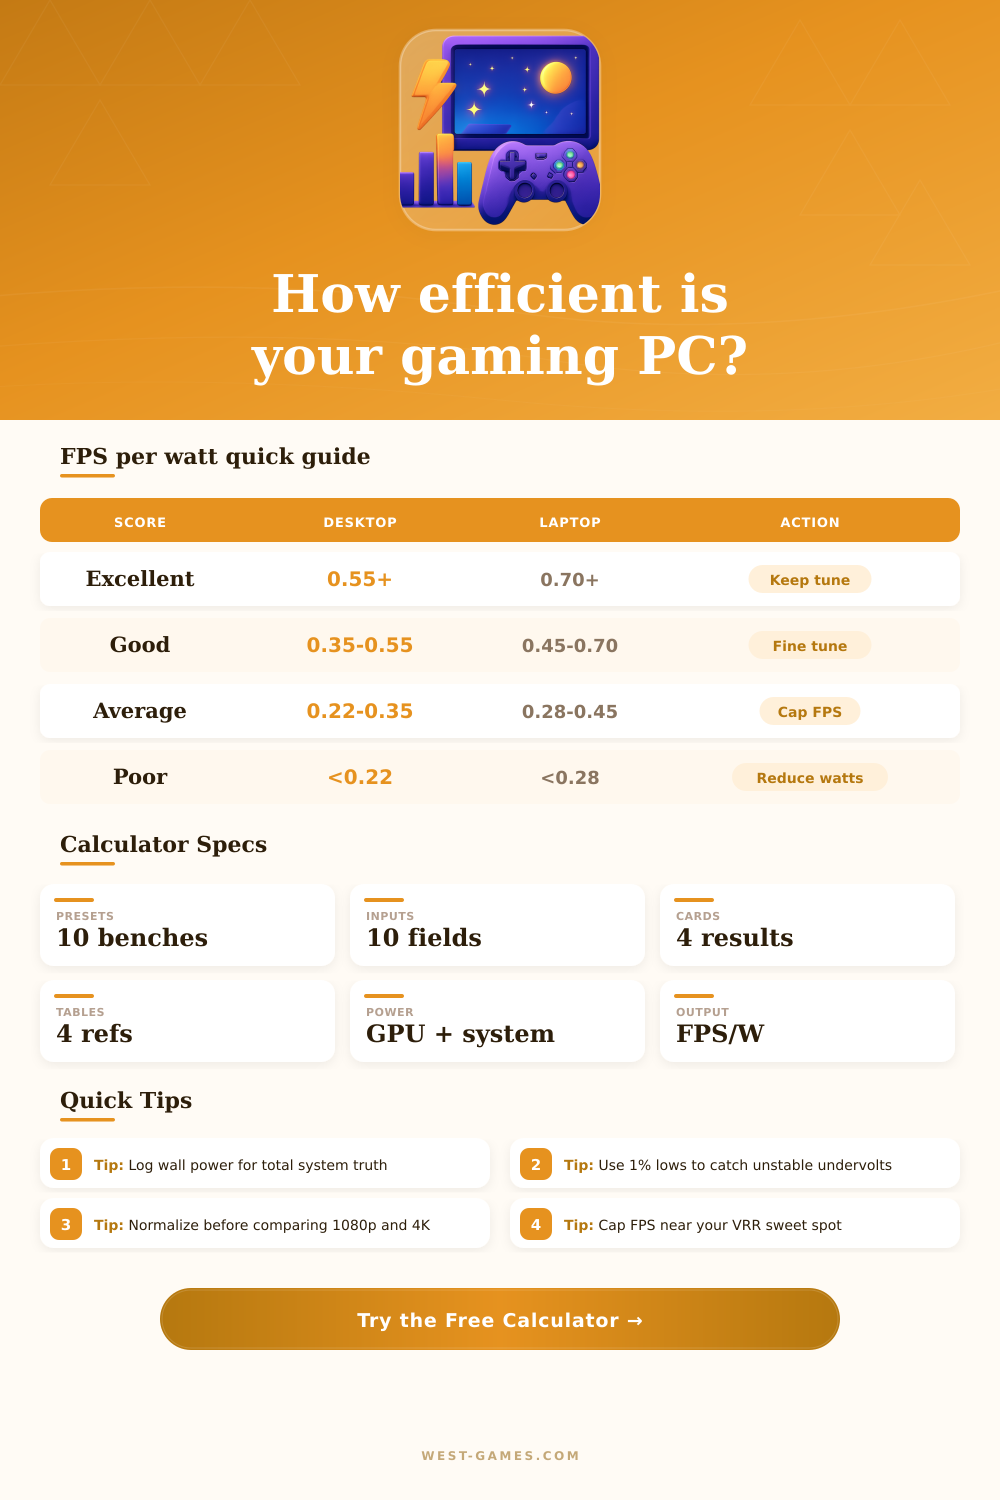
| Raw FPS/W | Status | Common setup | What to try |
|---|---|---|---|
| 0.65+ | Excellent | Efficient desktop, laptop, or capped esports run | Keep the cap and fan curve. |
| 0.45-0.64 | Very good | Modern GPU with tuned power limit | Check whether lows stay stable. |
| 0.30-0.44 | Good | Typical 1440p high gaming PC | Try a small undervolt or FPS cap. |
| 0.18-0.29 | Average | Ultra or RT settings at high board power | Reduce RT, shadows, or voltage. |
| Under 0.18 | Poor | Uncapped menus, heavy RT, or inefficient old hardware | Cap FPS and verify watt readings. |
Whole-system FPS/W is the best number for electricity, heat, noise, and small-room comfort because it includes the CPU and platform.
| Resolution | Pixel scale | Use case | Compare note |
|---|---|---|---|
| 1280x720 | 0.44x | Handheld and low-power modes | Raw FPS/W can look high because pixel load is light. |
| 1920x1080 | 1.00x | Baseline esports and budget GPUs | No pixel adjustment needed. |
| 2560x1440 | 1.78x | Mainstream high-refresh gaming | Normalized FPS/W rewards the higher workload. |
| 3440x1440 | 2.39x | Ultrawide high settings | Compare against 4K only after normalization. |
| 3840x2160 | 4.00x | 4K and TV gaming | Raw FPS/W is lower, but workload is much heavier. |
The calculator multiplies FPS/W by pixel scale, quality load, and workload factors, then discounts upscaling or frame generation where appropriate.
| Power input | Includes | Best for | Caution |
|---|---|---|---|
| GPU board power | Graphics card only | Undervolting, power limits, GPU comparisons | Ignores CPU, fans, motherboard, and PSU losses. |
| CPU plus system estimate | CPU package and platform power | Quick total gaming estimate | Sensor totals may miss PSU conversion losses. |
| Wall meter | Entire PC and PSU losses | Energy cost, heat, and quiet-room tuning | Monitor power should usually stay separate. |
| Laptop adapter | Whole device and charging losses | Performance modes and battery plans | Battery charging can inflate watts during tests. |
| Capture overhead | Stream card, USB dock, lighting, fans | Streamer or desk setup comparison | Add only loads active during the benchmark. |
For repeatable tuning, collect FPS and watts from the same run and avoid mixing GPU-only efficiency with wall-power efficiency.
| Symptom | Likely waste | Calculator clue | Efficiency move |
|---|---|---|---|
| High FPS, high watts | Uncapped rendering | Average FPS far above target | Set a cap below refresh or VRR ceiling. |
| Good average, poor 1% low | CPU spikes or unstable undervolt | Low consistency under 70% | Back off memory/GPU tune or lower background load. |
| GPU share over 85% | Graphics-limited board power | GPU watts dominate total | Use power limit, quality upscaling, or lower RT. |
| System watts high | CPU, fans, pump, or platform draw | CPU/system power rivals GPU power | Tune CPU limits and fan curves. |
| Raw FPS/W low but normalized high | Heavy resolution or RT workload | Large pixel and quality factors | Judge against same-quality results. |
The best efficiency tune is usually the one that keeps 1% lows stable while trimming watts that do not improve visible smoothness.
| Preset | Avg / 1% low | GPU W | System W | Resolution and goal |
|---|---|---|---|---|
| 1080p esports cap | 240 / 190 FPS | 150 W | 80 W | Fast competitive cap with good lows. |
| 1440p high balanced | 132 / 104 FPS | 245 W | 85 W | Mainstream high-refresh AAA run. |
| 4K RT quality | 74 / 56 FPS | 330 W | 95 W | Heavy quality mode with RT enabled. |
| Handheld 40 FPS | 40 / 33 FPS | 18 W | 10 W | Portable battery-aware gaming. |
| Undervolted 1440p | 126 / 101 FPS | 205 W | 78 W | Power-limit tune with small FPS loss. |
| Streaming capture | 118 / 88 FPS | 255 W | 120 W | Gameplay plus encode and accessory load. |
Presets are practical modelling examples. Replace them with your own benchmark logs for hardware decisions.
When creating a gaming rig, it’s easy to obsess over raw performance figures. You browse benchmark charts and you seek maximum average frame rate. But that’s just half the story. And often the most costly half of the problem.
The other metric is efficiency: How many watts are you drawing from wall per unit of visual smoothness? It determines how sustainable your system is in hot weather or cramped quarters, as well as its thermal output and noise level.
Why Gaming PC Efficiency Matters
This is where the calculator on this page come in. It doesn’t simply split up watts by frames. Rendering a scene at four thousand pixels across are much more demanding than standard definition, so that process takes far longer; the calculator factors that in. So you provide both your power draw, and your resolution, it then normalizes all of these different setups into a common language.
A cinematic 4K rig gets compared to an esports monitor with a higher refresh rate, while running at 1080p, without any sense that you’re comparing apples to oranges. The normalization deals with the math behind how much the pixels weigh so you don’t need to stress about it yourself.
When we talk about efficiency, one of the most difficult aspects of measurement is knowing what’s being measured. Many users look at their GPU software and see that number labeled as board power. It’s amount drawn by just the graphics card. While this is valuable information if you want to tune the voltages on the card, it doesn’t take into account anything else in your system.
Your power supply unit converts power, losing efficiency doing so; your motherboard runs fans and controllers; your processor draw power. If you want to know how much it costs to run, or how loud your PC will be, you need wall-level accuracy. It includes system overhead and CPU usage to give you a true whole-system view. This holistic approach keeps us from praising an efficient GPU while overlooking the power-hungry platform surrounding it.
The efficiency score also takes into account stability. Sure, having a high average frame rate mean nothing if you have low percentile drops that cause stutters and kill your overall experience. These spikes tend to be caused by thermal throttling or other memory bandwidth issues… Causing massive amounts of wasted power while still not feeling smooth.
Your one percent lows is taken into consideration by this calculator, penalizing runs where high power draw isn’t met with consistent delivery. So if you have some nice looking averages but really horrible lows, it’ll show that instability with your efficiency rating. It makes you think about aiming for consistency instead of just your absolute highest possible theoretical number.
The other wrinkle here is how those numbers are upscaled. Frame generation features can effectively double your on-screen framerate without actualy doubling the work on your GPU. On paper, this sounds like a free performance boost, but there’s a cost associated with it (visual fidelity and input latency).
When you choose an upscaling mode, the tool will adapt its efficiency score accordingly. So artificially boosting your framerates won’t unreasonably inflate the number compared to native rendering. It recognizes today’s rendering tricks as useful tools, but still rewards actual graphical throughput.
So all of this chasing each individual frame per watt is a diminishing returns exercise. At some point, tuning for another 5 watts will take longer then that extra five watts will save on electricity bills. These reference tables serves as wide ranges against which to judge your system. If you’re in either the excellent or good category, you’re probably pretty well optimized.
It’s not about being perfect, it’s about finding balance. It offers enough performance to have a responsive feel without creating so much heat that you need an industrial air conditioner. This ratio is what provides you with the data needed to make these quiet, cost conscious decisions instead of having to rely on guesswork. That’s efficiency: using what you’ve got and not wasting it when you need something else.
Whether you’re a competitive shooter looking to crank up those ray tracing settings or a narrative adventure player who just wants to cap off some frames, your power budget tells you how to tune that experience based on your true tastes. The numbers inform the choice, while your comfort determines the outcome.
You should of checked this earlier if you want more moddern gear.