🌡 CPU Delta T Calculator
Calculate CPU temperature over ambient, model cooler thermal resistance, compare package power against airflow and paste contact, and estimate cooling efficiency plus thermal headroom.
Estimated load temperature with your current effective resistance.
Adds 25 percent effective heatsink or radiator airflow.
Models paste, pressure, and coldplate contact closer to ideal.
Models a cooler or radiator with 15 percent lower base resistance.
| Cooler class | Typical C/W | Power fit | Thermal note |
|---|---|---|---|
| Stock radial / boxed | 0.35-0.55 | 35-90 W | Acceptable for locked CPUs, hot with sustained all-core loads. |
| Low profile SFF | 0.22-0.40 | 45-125 W | Limited by fin area, case exhaust, and socket clearance. |
| Single tower air | 0.15-0.25 | 65-170 W | Good gaming choice when case airflow is clean. |
| Dual tower air | 0.10-0.18 | 105-230 W | Strong sustained cooling if RAM and case clearance fit. |
| 240 mm AIO | 0.11-0.18 | 125-230 W | Depends heavily on radiator intake temperature and pump speed. |
| 360 mm AIO / loop | 0.07-0.13 | 170-320 W | Better water volume and radiator surface for high package power. |
Use the C/W input as a modelling estimate. Actual results depend on die size, coldplate shape, mounting hardware, and fan curve.
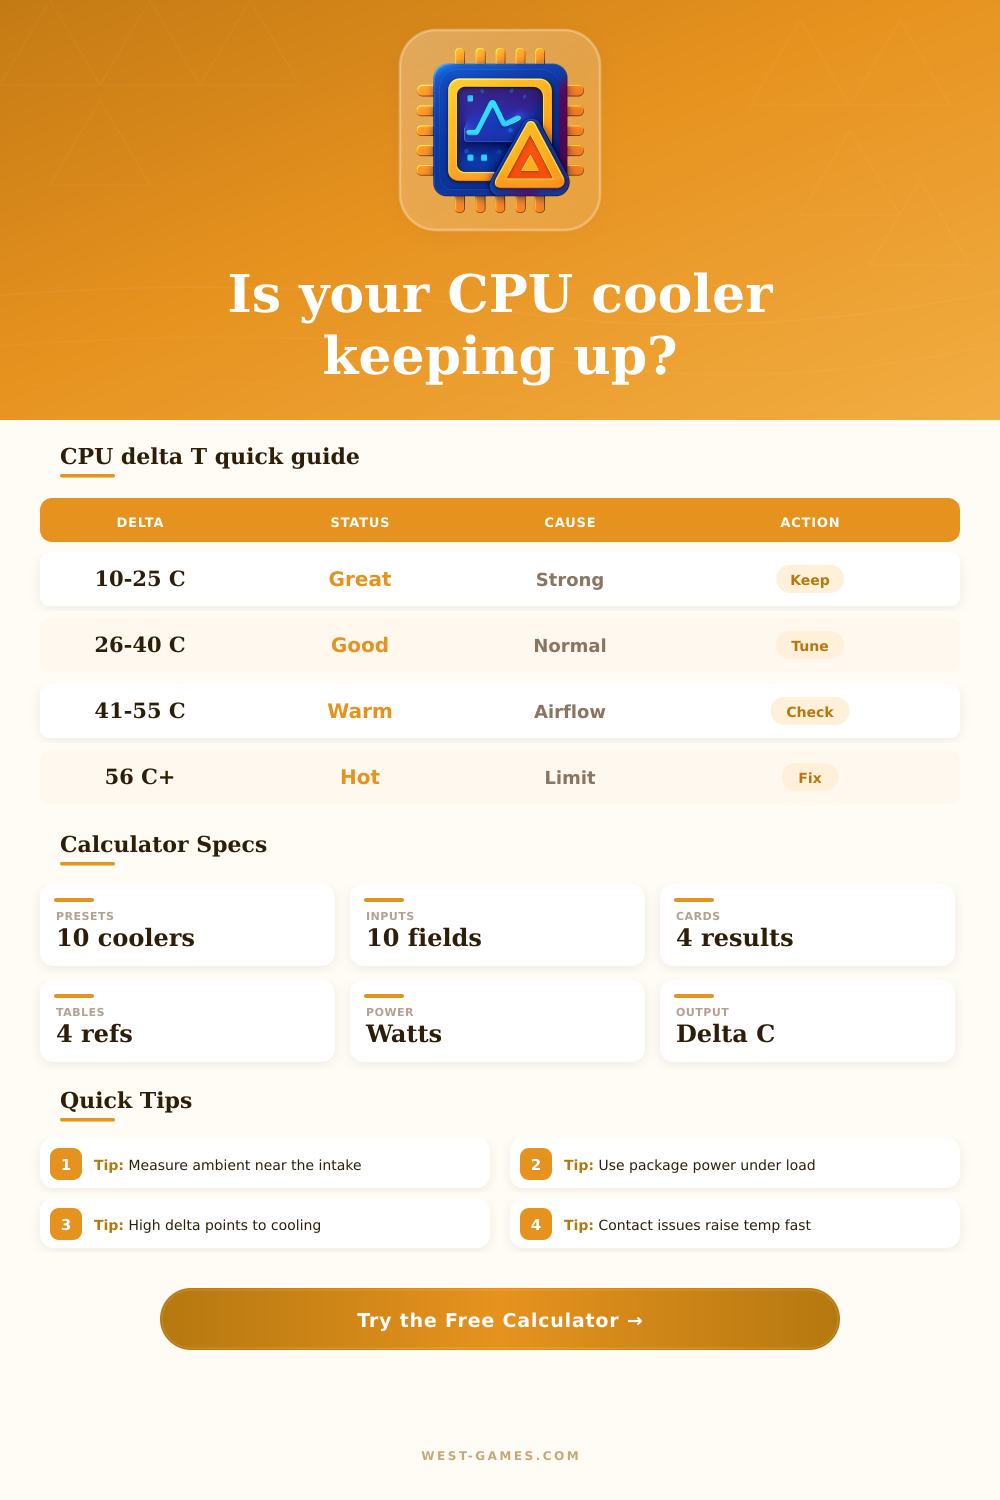
| Measured delta | Status | Common meaning | Next check |
|---|---|---|---|
| Under 20°C | Excellent | Low power or very strong cooling | Fan curve can likely be quieter. |
| 20-35°C | Healthy | Normal gaming and creator loads | Confirm clocks are not power limited. |
| 36-50°C | Warm | High watts, airflow loss, or compact case | Compare model delta and measured delta. |
| 51-65°C | Hot | Cooler near limit or contact problem | Inspect mount pressure, paste, and exhaust. |
| Over 65°C | Critical | Throttling likely on many CPUs | Reduce power or upgrade cooling path. |
Delta over ambient is better than raw CPU temperature because it adjusts for summer rooms, warm offices, and cold test benches.
| Load type | Typical watts | Cooler target | Planning signal |
|---|---|---|---|
| Esports gaming | 35-95 W | Stock to tower | Noise and boost stability matter more than peak wattage. |
| Modern AAA gaming | 65-150 W | Single tower or 240 AIO | Watch transient spikes and case GPU heat. |
| All-core productivity | 105-230 W | Dual tower or 240/360 AIO | Sustained package power sets the useful delta target. |
| AVX stress tests | 150-320 W | 360 AIO or loop | Worst-case loads often exceed gaming thermal needs. |
| Eco undervolt | 45-125 W | Quiet air or AIO | Lower watts usually improves delta more than fan speed. |
If package power doubles, cooler delta roughly doubles unless resistance improves or the CPU reduces clocks.
| Symptom | Likely factor | Calculator clue | Practical check |
|---|---|---|---|
| Idle okay, load spikes instantly | Coldplate contact | Measured delta far above model | Remount evenly and check paste spread. |
| Temperature rises slowly | Radiator or case heat soak | Restriction and airflow dominate | Open side panel test and log intake air. |
| High fan noise, little gain | Dense fins or blocked exhaust | Airflow improvement card shows small change | Clean filters and improve rear/top exhaust. |
| Good delta but high raw temp | Warm room | Ambient input explains total CPU temp | Lower intake air or accept seasonal rise. |
| Power limit hits early | Cooler capacity | Safe watts below package power | Reduce PL2/PPT or choose lower C/W cooling. |
Use one change at a time. Re-test with the same benchmark, room temperature, and fan curve so the delta comparison stays clean.
| Preset | Base C/W | Airflow | Power | Best use |
|---|---|---|---|---|
| 65 W stock cooler | 0.42 | 32 CFM | 65 W | Locked desktop CPUs and light gaming loads. |
| Budget 120 mm tower | 0.24 | 48 CFM | 95 W | Entry gaming CPUs with a simple airflow case. |
| Single tower gaming | 0.19 | 58 CFM | 125 W | Midrange Ryzen 5, Ryzen 7, Core i5, and Core i7 gaming. |
| Dual tower air | 0.13 | 78 CFM | 180 W | Quiet high-end air cooling and sustained all-core work. |
| 240 mm AIO | 0.16 | 72 CFM | 170 W | Balanced gaming and creator builds with radiator clearance. |
| 360 mm AIO | 0.10 | 110 CFM | 240 W | High-power desktop CPUs and sustained boosts. |
These are practical planning values, not brand ratings. Edit the inputs when you have measured fan flow, radiator data, or review-tested C/W numbers.
When rendering or playing games and you notice that your CPUs is getting toasty, you might panic and think it’s time to upgrade your computer. While that’s understandable, it isn’t always right. Just because something gets hot doesn’t mean it’s running poorly; ambient temperature are irrelevant when measuring the effectiveness of a cooling system.
For example, an 85-degree CPU in a warm environment will be more efficient than a 70-degree CPU in a cool environment. What matters here is the difference: How many degrees warmer is your chip then the air around it? That takes out variables like outside temperature and tell you how effectively your cooler is doing its job.
Why Your CPU Temperature Difference Matters More Than The Number
Absolute temperature numbers are what many users look at. And it’s understandable why: they’re prominent. But ambient conditions vary based off the room and season. Judging cooling purely on peak numbers may lead you to buy more than you need. For example, maybe you have bad case airflow. Your current cooler isn’t limited by size; it’s limited by how much air can flow over it.
That’s where the calculator above come in. It will convert raw numbers into an efficiency score relative to your own environment. That’s where thermal resistance comes into play, the bottleneck that prevents heat from escaping your silicon towards outside world. Resistance is measured as an absolute value for each cooler; you can think of resistance like “temperature increase per watt of power.” Generally speaking, coolers with more resistance generates higher temperatures when under load (i.e., a big ol’ liquid loop or air cooler will be lower resistance than a simple stock fan).
And, of course, installation plays a huge part in the outcome. Even if you have all the expensive gear, poor mounting pressure/thermal paste application can add resistance and prevent heat from escaping where it need to go. Many cooling issues stem from poor air flow, but most builders don’t think about it. Even with high-powered fans, you can’t get good air movement through a radiator that’s mounted tightly or one that’s being blocked by dust on its filter.
Contact issues and airflow restrictions is accounted for by this tool; it gives you a more accurate assessment by factoring in your specific environment and load profile alongside those factors to go beyond just measuring temperatures. So if you find your measured delta is far above what the ideal model says it should of be, then the problem is probably not that it lacks the ability to cool, but something mechanical (e.g. The problem might be dirty vents or the need for better paste application. That kind of insight will save you money because it points out where you actualy need stuff like new hardware versus simply applying cleaner vents or getting better paste down.
A sustained workload affect thermal headroom. While gaming tends to be short bursts, there are other applications that holds the CPU hot for extended durations (e.g., video encoding). In those cases, heat soaks into components, and thermal headroom is important. The lower your delta, the more margin your cooling system have before running out of steam, letting you crank up the boost clock and perform at peak efficiency.
Conversely, if you run with a large delta all the time, you’re livig on the edge, meaning that small fluctuations (e.g., dust, ambient heat) will lead to throttling. By paying attention to this difference instead of absolute temps, you get a clear benchmark for when to upgrade/maintain. You don’t need to worry about the seasons, just pay attention to how well the setup’s engineered.