🎯 Valorant KDA Calculator
Calculate KDA, kill rate, death pressure, ACS context, first blood value, trade quality, role fit, and the exact stat gap to reach your target KDA.
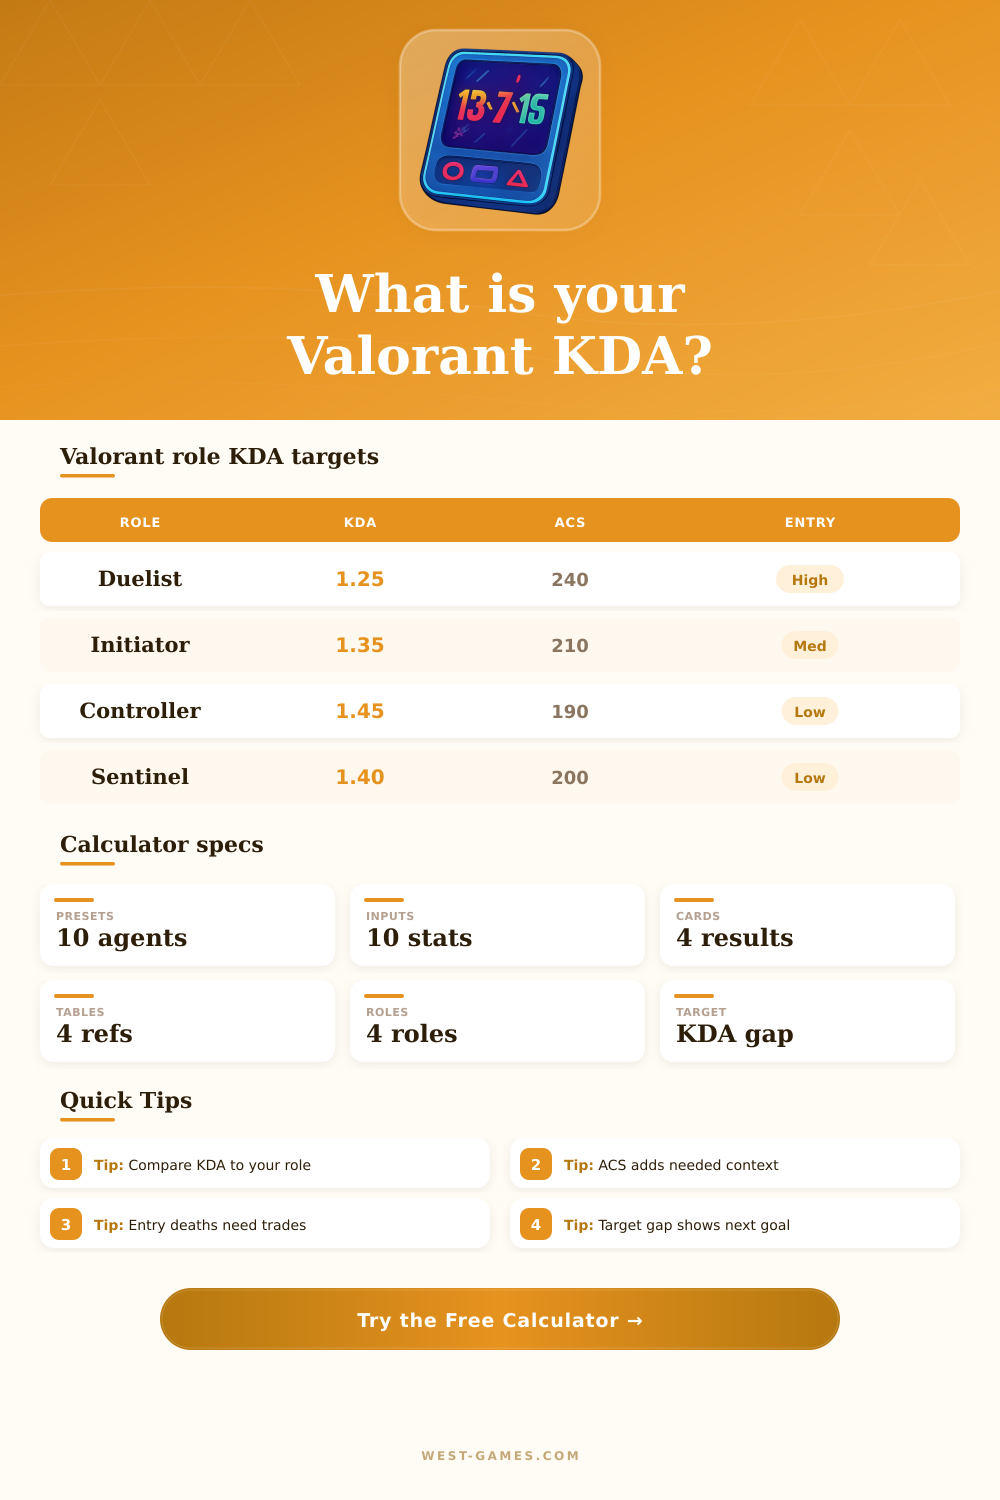
| Role | Target KDA | ACS range | Best signal |
|---|---|---|---|
| Duelist | 1.20-1.40 | 230-280 | First bloods |
| Initiator | 1.30-1.55 | 190-235 | Assists |
| Controller | 1.35-1.65 | 175-220 | Survival |
| Sentinel | 1.30-1.60 | 185-230 | Trades |
| Flex fill | 1.25-1.55 | 190-240 | Balance |
Targets are role-based calculator anchors. Map, economy, team plan, and overtime length can move the expectation.
| KDA band | Read | Likely issue | Next focus |
|---|---|---|---|
| Under 0.90 | Rough | Deaths high | Trade setup |
| 0.90-1.19 | Below role | Low conversion | Safer fights |
| 1.20-1.49 | Stable | Role dependent | ACS context |
| 1.50-1.99 | Strong | Good value | Round impact |
| 2.00+ | Dominant | Carry line | Win conversion |
A high KDA in a loss can still hide low entry pressure, low damage, or late-round kills that did not convert rounds.
| ACS | Signal | KDA use | Role note |
|---|---|---|---|
| Under 150 | Low | Question | Utility roles only |
| 150-189 | Light | Support check | Needs assists |
| 190-229 | Solid | Reliable | Most roles fine |
| 230-279 | Strong | High impact | Entry ready |
| 280+ | Carry | Star output | Convert rounds |
ACS gives damage and combat involvement context, while KDA shows survival and participation efficiency.
| Signal | Low | Good | Excellent |
|---|---|---|---|
| First blood rate | Under 5% | 8-14% | 15%+ |
| First death rate | 16%+ | 8-15% | Under 8% |
| Trade share | Under 25% | 25-45% | 45%+ |
| Kills per round | Under .55 | .60-.85 | .90+ |
| Deaths per round | .80+ | .55-.75 | Under .55 |
Trade share combines traded kills and traded deaths against total deaths to estimate whether contact turns into team value.
Ranked play in Valorant has its own particular type of nightmare: you can carry a round and still lose the match. Your team is falling apart on Site A while you get five kills in the last minute, all you have to show for it is a statistical highlight that doesn’t mean a thing on the scoreboard. That’s why raw number fails as a player.
Until you put some context around that kill, it’s just a kill, and then what did it cost? And how much does it do for your overall outcome? The calculator above will run the math for you, but it’s understanding the story behind the inputs that actualy makes your game better.
Why Raw Kill Numbers Are Not Enough
Now the standard formula say kills + assists / deaths. Everything gets weighted equally. But that’s not how tactics shooter work at all.
The death of a duelist may open up room for another teammate to get an angle or set the spike. The death of a controller may only mean someone loses a little bit of vision control down the line. And then if you glance over at that role comparison part of the page, you’ll notice that some agents has higher baseline expectations in terms of what counts as ‘good’ performance.
Entry fraggers are expected to be more aggressive and take lower ratios. Their job is to draw out enemies and open things up. Controllers should of last longer so they can change map shapes with smokes. Without this lens, you’ll start evaluating your stats and you’ll be tempted to play safer as an entry fragger to increase one metric that never realy reflects how much you did.
The other important part of that is Average Combat Score. This take into account utility usage, and damage done and helps differentiate between passive stat padding and what actualy makes people effective in combat.
If you sit at the rear of a site for the last 20 rounds, you might get some easy head shots off of retaking players. You might have a nice looking ratio but your score would show you didn’t do anything to help secure those rounds in the first place. On the other hand, somebody who aggressively pushes and gets killed early, but causes mayhem for the opposition team will have worse survival numbers but better numbers that shows they was involved.
You ideally want both. However, knowing this difference keeps you from chasing the wrong number if you need to focus more on one or the other depending on your role.
Coordinated play is not about solo highlight reels; it’s about trade kills. A kill alone does nothing if it exposes your flank for an instant follow-up death. Did teammates answer those deaths promptly? Were they quick enough to turn those dives into kills? That contact worked well, you traded aggression for value instead of merely feeding points to the enemy.
A lot of players miss this dynamic. Many players ignore this dynamic because the highlight reel looks cool, even though the scoreboard tells a different story about team coordination.
Having a target allows you to work towards improving instead of just aimlessly playing matches. Your practice sessions become intentional when you know that, “To get this next rank, I’ll need X more assists/yet X fewer deaths.” It is no longer guesswork like asking, “Did I play well?” Instead, there is now something real to measure over time.
Having those reference tables means having a good idea of your standing different than expectations at every rank/role. Numbers are diagnostic, not the end of a discussion. They provides a snapshot of how your decisions match (or don’t) with best practices.
From there it’s about translating personal action to winning as a team… Are you trying to push in first? Are you anchoring site? What do you do now that the data points you in the right direction during the next time you practice? Use it to direct your focus and go back to the queue and act on lessons learned.