🎮 KDA LoL Calculator
Calculate League of Legends KDA, kill participation, CS per minute, role benchmark, target KDA path, and how many future games may be needed.
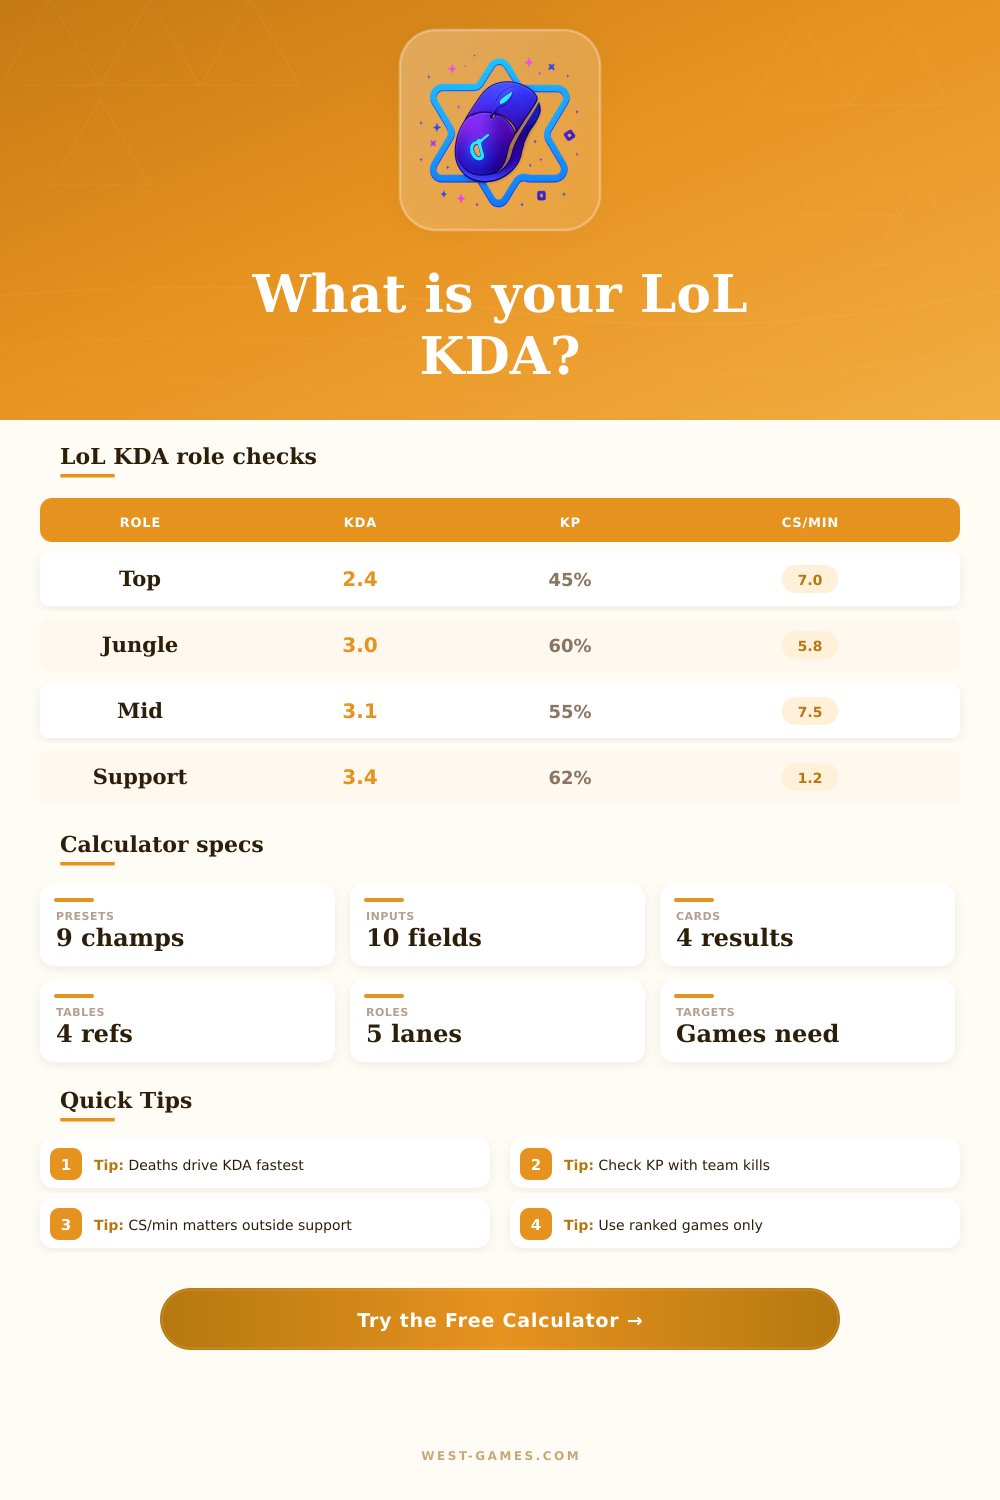
Top KDA can run lower because side-lane pressure, split-push deaths, and front-line duties add risk.
Benchmark 2.4 KDAJunglers should usually show strong KP because ganks, objectives, and skirmish timing touch every lane.
Benchmark 60% KPMid profiles are judged by KDA plus roam conversion, so assists matter when lane pressure becomes map pressure.
Benchmark 3.1 KDAADC KDA rewards late fight survival. High deaths usually erase strong damage and farming numbers quickly.
Benchmark 7.8 CS/minSupport KDA leans on assists and kill participation, while CS/min is intentionally treated as low priority.
Benchmark 3.4 KDATarget games only work if the future stat line has a better KDA pace than the target you selected.
Future ratio check| Role | Solid | Strong | Elite |
|---|---|---|---|
| Top | 2.0 | 2.8 | 3.8+ |
| Jungle | 2.5 | 3.3 | 4.5+ |
| Mid | 2.6 | 3.4 | 4.6+ |
| ADC | 2.4 | 3.2 | 4.4+ |
| Support | 2.8 | 3.8 | 5.0+ |
Benchmarks are calculator guideposts for comparing your own samples, not official Riot ratings.
| KP range | Readout | Typical issue |
|---|---|---|
| Under 35% | Isolated | Low map contact |
| 35% to 49% | Quiet | More rotations |
| 50% to 64% | Active | Healthy impact |
| 65% to 79% | Very active | Teamfight core |
| 80%+ | Everywhere | Check sample size |
| Role | Low | Good | High |
|---|---|---|---|
| Top | Under 5.8 | 6.5 to 7.5 | 8.0+ |
| Jungle | Under 4.7 | 5.3 to 6.2 | 6.8+ |
| Mid | Under 6.2 | 7.0 to 8.0 | 8.5+ |
| ADC | Under 6.4 | 7.2 to 8.4 | 9.0+ |
| Support | 0 to 1.0 | 1.0 to 1.8 | Varies |
| Preset | K/D/A | Future KDA |
|---|---|---|
| Safe | 4 / 2 / 8 | 6.00 |
| Carry | 8 / 4 / 7 | 3.75 |
| Support | 1 / 3 / 14 | 5.00 |
| Jungle | 6 / 3 / 10 | 5.33 |
| Snowball | 12 / 3 / 9 | 7.00 |
| Rough | 4 / 7 / 6 | 1.43 |
If future KDA is below the target, the selected pace cannot mathematically reach that target.
Win rate is one piece of an improvement, but in some games, that’s not nearly as important than other small stats. KDA is something you can see, but it’s easy to mistake it for a definitive answer. This calculator do all the conversion and coefficient guessing for you. Just enter your sample size, and it will reveal how much weight you’re actualy carrying.
It’s pretty simple: The core formula boils down to kills plus assists divided by deaths. That leads to a ratio. Depending on how your team play and what kind of games you’re in, it can give an idea about your survivability. But does it indicate whether you spent 30 minutes crouched behind a tower? They chase the ratio without considering context of their role or the tempo of the games they are playing.
How to Use the Calculator to Improve Your Game
That’s why we let you choose specific role profiles. A bruiser playing in top lane shouldn’t be measured against an assassin playing in mid lane. Top laners is willing to take more risk in trades than other roles, lowering their KDA despite playing well. And mid laners has less excuse for bad positioning, shifting the benchmark again.
A better indicator of your impact on the map are the level of participation you have in a kill. This represents the number of kills your team made where you contributed either by getting an assist or making it happen yourself. Someone with a flawless 10.0 KDA may contribute only one-tenth of his team’s kills, meaning he has been playing a different game than his teammates. He may be farming like crazy, but he hasn’t brought the heat that makes the other side make mistakes.
To determine whether you’re integrated or isolated in fights, the calculator divide your average team kill number by the number of kills on that player and spits out the percentage for you. Farming won’t save you if you aren’t helping maintain map control. The final layer of performance is Farm Pressure. This is measured in CS per minute. It’s important for carries as gold is power. If you’re falling behind in farm, you’ll fall behind in the item threshold. Each successive fight will become more difficult to secure.
Here, supports are handled differently because their value comes from utility and vision rather than minion kills. By selecting your role when using the calculator, it tweaks its expectations accordingly, meaning a support won’t be punished by having lower CS. It’s about efficiency within the flow of your lane not some universal standard that ignores positional realities.
This means being realistic about what kind of player you’re going to be in the future, as well as honest with yourself about your target KDA… You can’t just hope that you’ll get a higher ratio. You also has to know what kind of stats go along with it. This is where the tool comes into play: How many more games do I need to play to reach my goal?
If you’re dying three times per game currently, and you want an elite ratio, you won’t accomplish anything by still dying four times a game; you’re only setting yourself up for frustration. Learn to make better engagement decisions and improve your roaming timing, thereby decreasing the denominator or increasing the numerator. Because ranked progression is cumulative, the math isn’t forgiving: Small improvements compound across dozens of games.
By keeping track of these stats, you’ll be able to identify trends that history hides. Maybe you die way more while roaming? Or maybe you get really tilted in long games and see your CS drop off. If you can find out what these patterns are, you can adjust accordingly, not with empty promises like “I’m going to play better,” but by making targeted changes.
There are also some reference tables to help you benchmark yourself. But don’t think of it as hard rules. Think of them more as guideposts. They give you an idea of how you’re doing compared to everyone else, and you can hone in on which exact input is pulling down your average score. It sounds like a little thing but it matters. So instead of trying to overhaul everything about your game in one patch, you fix one leak at a time and improve over time.
The calculator gives you an understanding of how much of an effect your decision had. It’s a shadow of a real decision you make in the rift, but it lets you quantify it and see it clearly. When you realize what something means, when you know the numbers aren’t the thing you’re trying to improve, you stop going for the vanilla stat and you play with purpose.
You learn to play for what has real impact on helping your team win, which in turn makes your KDA strong because it’s a byproduct of smarter, more involved gameplay. You should of looked at these stats sooner.