DLSS Render Resolution Calculator
Estimate internal render resolution, pixel count, performance multiplier, VRAM and bandwidth load, and quality notes for DLSS modes at 1080p, 1440p, ultrawide, 4K, and 8K.
Baseline full output resolution.
Current DLSS mode and settings.
Sharper custom scale if the game allows it.
Performance mode style pixel load.
| Mode | Scale | Pixel load | Typical use |
|---|---|---|---|
| DLAA / Native AA | 100% | 100% | Native internal resolution with anti-aliasing focus. |
| Ultra Quality style | 77% | 59% | High clarity when the game or mod exposes it. |
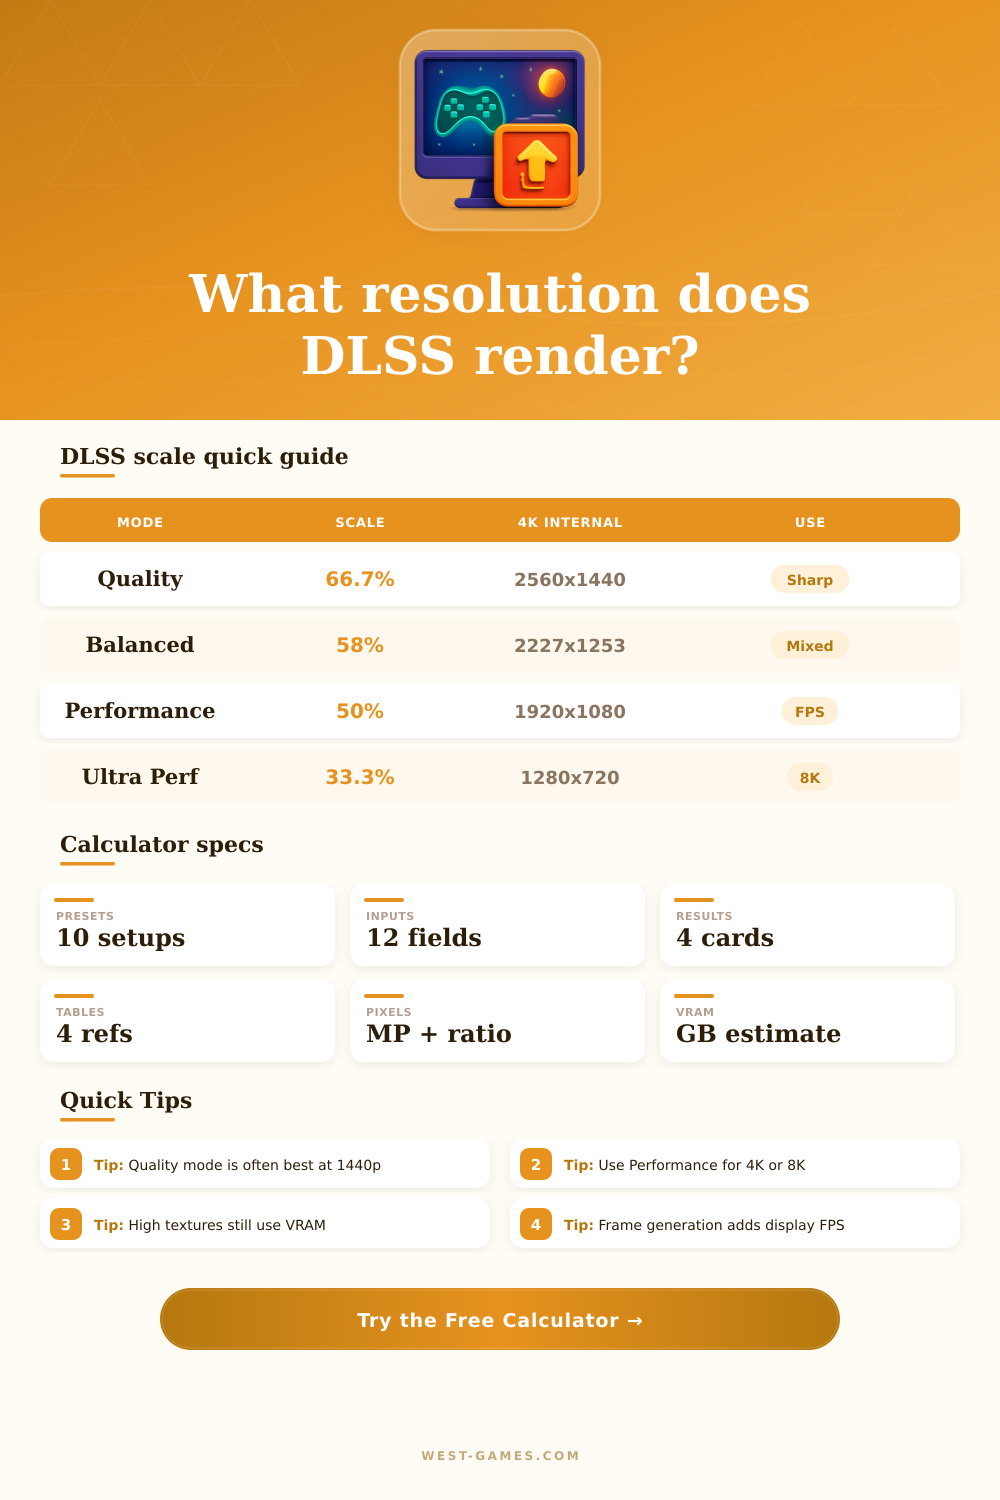
| Quality | 66.7% | 44% | Common sweet spot for 1440p and 4K visual quality. |
| Balanced | 58% | 34% | Good mix when ray tracing or high refresh needs help. |
| Performance | 50% | 25% | Useful for 4K high settings, heavy RT, or weaker GPUs. |
| Ultra Performance | 33.3% | 11% | Designed mainly for very high output resolutions such as 8K. |
The calculator uses common internal scale factors; individual games may expose custom sliders or slightly different behavior.
| Output | Quality | Balanced | Performance |
|---|---|---|---|
| 1920 x 1080 | 1280 x 720 | 1114 x 626 | 960 x 540 |
| 2560 x 1440 | 1707 x 960 | 1485 x 835 | 1280 x 720 |
| 3440 x 1440 | 2294 x 960 | 1995 x 835 | 1720 x 720 |
| 3840 x 2160 | 2560 x 1440 | 2227 x 1253 | 1920 x 1080 |
| 5120 x 2160 | 3413 x 1440 | 2970 x 1253 | 2560 x 1080 |
| 7680 x 4320 | 5120 x 2880 | 4454 x 2506 | 3840 x 2160 |
| Scenario | Output | Mode | Reason |
|---|---|---|---|
| Competitive shooter | 1440p | Quality or native | Keeps clarity high while lifting render FPS. |
| Cinematic RPG | 4K | Quality | Good visual balance for foliage, hair, and distant detail. |
| Heavy ray tracing | 4K | Balanced | Frees pixel work for RT effects and high settings. |
| Path tracing | 4K | Performance | Large pixel reduction helps demanding lighting paths. |
| 8K showcase | 8K | Ultra Performance | Still renders roughly a 1440p internal pixel count. |
| Ultrawide | 3440x1440 | Quality | Preserves HUD and texture detail across wide FOV. |
| Item | Scales with pixels? | DLSS effect | Watch for |
|---|---|---|---|
| Color and depth buffers | Mostly yes | Can drop with internal resolution | High resolution plus MSAA-like buffers |
| Textures | Mostly no | Remain near chosen texture quality | Ultra texture packs still need VRAM |
| Ray tracing structures | Partly | Depends on engine and effects | RT reflections and path tracing history |
| Frame generation | No | Adds display frames after rendering | Extra frame buffers and latency settings |
| Memory bandwidth | Often yes | Usually falls with pixel load | Post-processing and reconstruction overhead |
| Render scale | Internal pixel load | Visual risk | Best match |
|---|---|---|---|
| 100% | 100% | Lowest reconstruction risk, highest GPU cost. | DLAA, native esports, screenshots, CPU-limited games. |
| 75% to 80% | 56% to 64% | Very good clarity; small shimmer risk in fine detail. | Premium 1440p, 4K quality tuning, wide monitors. |
| 66% to 67% | 44% | Common quality tradeoff; usually stable at 1440p or higher. | DLSS Quality mode and high settings. |
| 58% | 34% | More reconstruction pressure in motion and thin lines. | Balanced mode for RT and high refresh targets. |
| 50% | 25% | Visible softness possible at 1080p, better at 4K output. | Performance mode for 4K and demanding effects. |
| 33% | 11% | Largest clarity risk unless output resolution is very high. | Ultra Performance mode for 8K or emergency FPS. |
In a cinematic scene, you check out your GPU usage graph and see that your frame rate has tanked when you still have available memory. These days it’s not usually because there are too many polygon. No, instead it’s in the hidden layer between what your chip produces and what you actualy see on screen.
Enter Deep Learning Super Sampling (DLSS), which essentially starts rendering scenes at lower resolutions and then upscales them to match your monitor. Whether it appears artifact-filled or crisp depend entirely upon how many pixels it skips over. When you choose your mode and set your output resolution, the calculator does the rest; no more guessing about bandwidth savings or pixel ratios.
What is DLSS and How It Works
For most people, DLSS modes is shown as quality tiers instead of mathematical numbers. Quality mode will generaly render at around sixty-seven percent of your native resolution (width and height). That doesn’t seem like much until you remember that it scale exponentially in terms of area. The AI use spatial context and temporal history to fill in gaps and reconstruct missing edges that weren’t in the buffer. It do this while maintaining most of the visual quality using less than half of pixel data from a native render.
Because texture memory doesn’t decrease as you decrease the render scale, people often gets confused about how VRAM behaves. Whether you’re rendering at native 4K and then upscaling that image, or simply starting with a 1080p image and increasing its size, those high-res textures will retain there original file sizes. To compensate for that, the calculator splits out texture share from overall bandwidth load. Switch to ultra on textures and watch as your total VRAM usage remain elevated while estimated pixel fill rate drops a lot. That’s why certain games struggle on low-end cards despite having aggressive upscaling options: the memory limit becomes the bottleneck different than raw shader power.
The other variable is how difficult it is for objects to move. It looks fine if you pause the menu, but then a camera pan through thick vegetation show reconstruction errors. Thin lines, such as power cables and fences, are particularly prone to this because they occupy fewer pixels in the internal buffer (and thus the AI has less data to work with). Motion complexity determines how the tool assesses its own quality: When there’s lots of motion, the tool will set more conservative settings so it won’t blur out or ghost an object turning quickly. Little things like this matter once you’re tracking down an enemy amid a chaotic battlefield.
Things get more complicated when frame generation starts to insert whole new frames in-between the rendered ones, bumping up displayed FPS while leaving render resolution unchanged. It gives appearance of smoother motion but can also cause increased input latency (if not handled well). The calculator separates render FPS from display estimates, so you can tell the difference between what is actually being computed and how smooth things look. For competitive players, balanced latency despite lower visual frame count are often a preferred setting. Milliseconds add up with quick inputs.
You have to pick the right resolution based off performance requirements and clarity. For example, Ultra Performance mode is actualy running at about a third of its native resolution (so it’s great for an 8K display), but not so good when you’re on something like a 1080p display with huge obvious pixels. There’s a table of tradeoffs on the page that show this for various output resolutions. What you notice here is that something like a 4K screen is happy being downsampled more than something like a 1440p screen. It’s all about matching the pixel density inside to what you’ll be looking at from afar.
DLSS does not represent some magic cure-all for old hardware. Instead it represents a very clever compromise: moving the computing burden to a neural reconstruction process. If done right, it stretches out the useful lifespan of your high-end GPU because now they’re always kept busy on something meaningful instead of drowning in pixel waste. And the knob is yours. The math just spells out how much you’re giving up at each step.
You should of checked the settings first.