🎮 Frame Pacing Variance Calculator
Analyze frametime samples for average FPS, 1% low, 0.1% low, standard deviation, jitter, spike count, VRR coverage, and a practical smoothness score.
Calculated from the active frametime sample set.
Shows whether the average and lows fit the selected display refresh.
Percent of frames whose instantaneous FPS stays inside the VRR range.
A practical cap based on low FPS and the selected VRR ceiling.
| Refresh | Frame budget | Good 1% low | Use case |
|---|---|---|---|
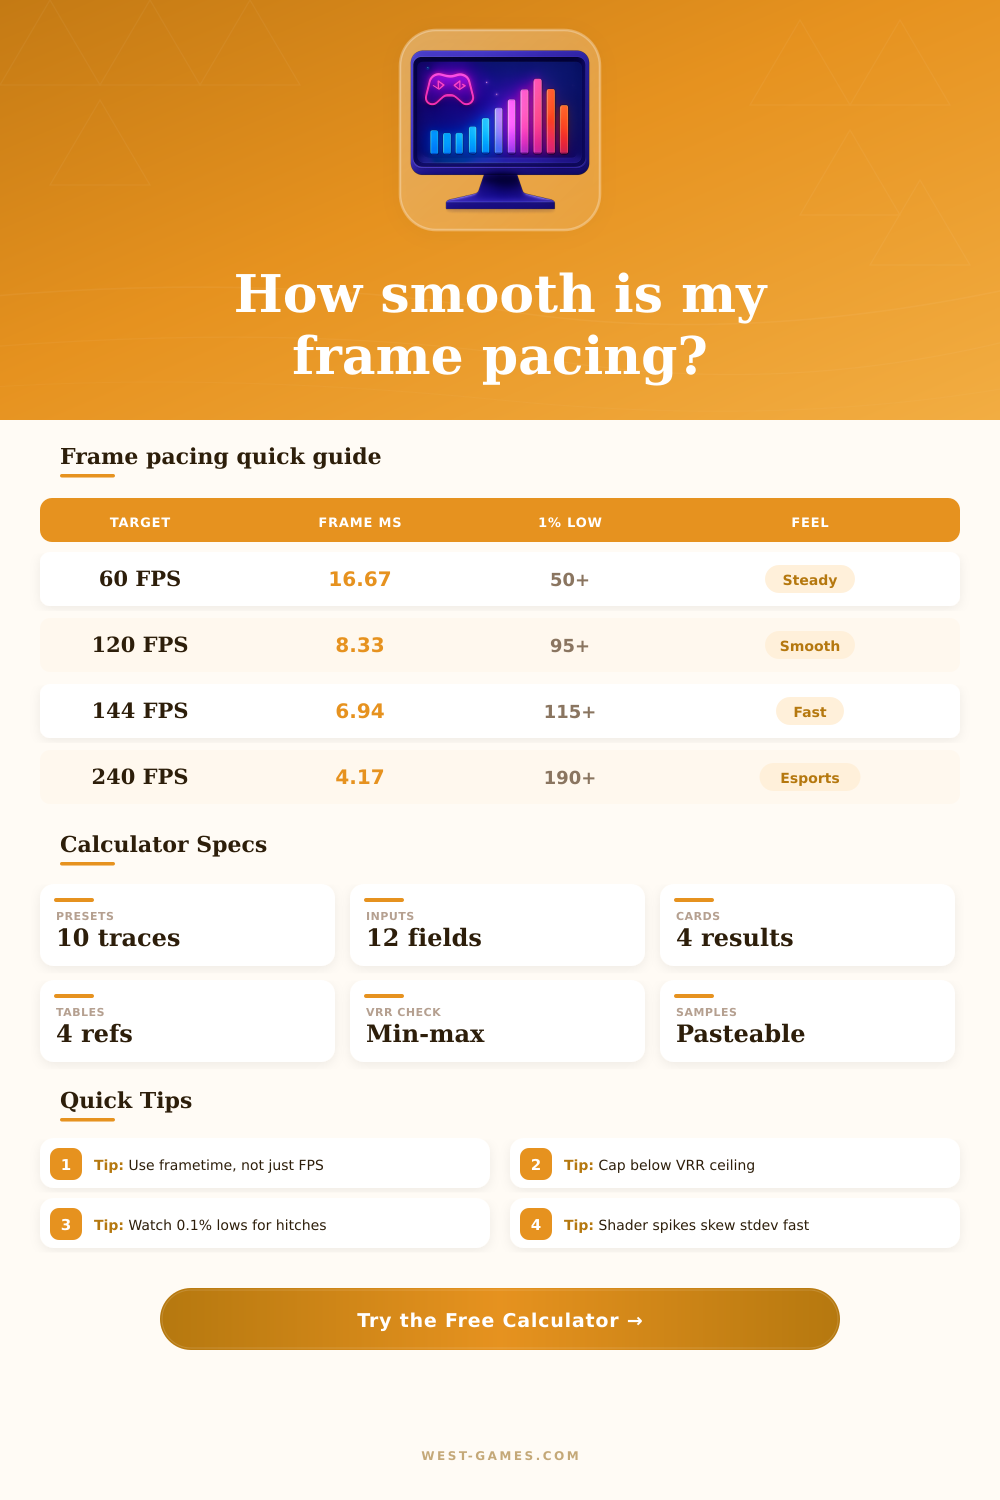
| 60 Hz | 16.67 ms | 50 FPS or higher | Console quality, cinematic games |
| 120 Hz | 8.33 ms | 95 FPS or higher | Console performance and TV VRR |
| 144 Hz | 6.94 ms | 115 FPS or higher | General PC gaming |
| 165 Hz | 6.06 ms | 130 FPS or higher | 1440p high refresh |
| 240 Hz | 4.17 ms | 190 FPS or higher | Competitive shooters |
| Metric | Clean | Watch | Problem sign |
|---|---|---|---|
| Std deviation | Under 0.5 ms | 0.5-1.5 ms | Above 1.5 ms |
| Jitter percent | Under 6% | 6-14% | Above 14% |
| 1% low gap | Under 15% | 15-30% | Above 30% |
| 0.1% low gap | Under 25% | 25-45% | Above 45% |
| Spike count | 0-1 per minute | 2-5 per minute | Repeated hitch pattern |
| VRR range | Target cap | Good lows | Practical read |
|---|---|---|---|
| 40-120 FPS | 116-118 FPS | Above 48 FPS | Common TV VRR window with LFC support |
| 48-144 FPS | 138-141 FPS | Above 55 FPS | Common PC monitor range |
| 48-165 FPS | 158-162 FPS | Above 60 FPS | Strong 1440p monitor setup |
| 48-240 FPS | 225-235 FPS | Above 90 FPS | High refresh esports range |
| 30-90 FPS | 86-88 FPS | Above 35 FPS | Handheld and portable display range |
| Value | What it measures | Best for | Warning |
|---|---|---|---|
| Average FPS | Overall mean frametime converted to FPS | Throughput comparison | Can hide stutter |
| 1% low | Average of the slowest 1% of frames | Repeatable roughness | Needs enough samples |
| 0.1% low | Average of the slowest 0.1% of frames | Major hitches | Very sensitive to short captures |
| Std deviation | Spread around mean frametime | Pacing stability | Does not show timing order |
| Spike count | Frames beyond chosen threshold | Hitch hunting | Threshold choice matters |
| Preset | Average target | Refresh / VRR | Variance model | Typical pacing lesson |
|---|---|---|---|---|
| 1080p 240 Hz Esports | 238 FPS | 240 Hz / 48-240 | Low variance, tiny spikes | Great averages still need low input and render queue stability. |
| 1440p 165 Hz High | 150 FPS | 165 Hz / 48-165 | Moderate scene variance | VRR hides small waves when lows stay inside the window. |
| 4K 60 Console Mode | 60 FPS | 60 Hz / 40-60 | Small variance with occasional budget miss | A few 25 ms frames are more visible than the average suggests. |
| Shader Compile Spikes | 118 FPS | 144 Hz / 48-144 | Rare large hitches | 0.1% low and spike count expose compile stutter quickly. |
| Handheld 40 FPS Cap | 40 FPS | 40 Hz / 30-90 | Stable cap, slower budget | Even frame delivery can feel good despite a lower FPS number. |
The preset data is generated from the visible settings, so changing variance, VRR, or spike threshold immediately changes the analysis.
But even if you’re running monitor with high-enough refresh rate for smooth rendering of on-screen images, you might find your aiming slightly out-of-whack. And yes, you probably checked your average frame rate and found it’s a solid number, so, all must be well. Nope. That wasn’t the issue. That was the average.
What you couldn’t see in those frames was the variance, which humans notice easily and an average can’t hide. Frame pacing is what deliver the real-world gaming experience. Typically, most people measures only average (frames per second). Focusing on higher means are fine for raw throughput but terrible for smoothness. While your graph may appear green, there could be hundreds of little dips into red where game was outputting just thirty frames per second in intense moments.
Why Averages Are Not Enough for Smooth Gaming
These drops feel like lag and the calculator reveals what your eyes are actualy seeing. Once you input your frametime data, the calculator do all the math for you. It takes away the illusion that graph is average by showing you exactly what your eyes are seeing. It looks at specific low points and standard deviation to separate signal from the noise. This tells you if those hitches is a structural problem with your setup or just random errors.
All this stuff about low percentiles makes you think different than performance metrics. The one percent low is a good general guide because it smooths out odd frame-by-frame issue while still catching when performance are consistently poor. So it paints a reasonable view of the worst sustained moment without getting tricked into thinking one-off shader compilation spikes mean anything.
And then there’s the zero point one percent low, this focus on the very tail end of the distribution. This is where the big stutters hang out. If that’s way down from your average, regardless of how high you might be peaking in terms of performance, your game will feel jumpy. Is it jittery? Is motion fluid or does it get a little buzzy?
High frametime standard deviation directly relate to noticeable shake when making fast turns or panning the camera around. It kills precision aiming and ruins immersion. You may be rocking a beefy graphics card and playing a demanding game, but if engine can’t keep up and render each frame in the allotted time window, all that power goes to waste.
The tool measures this by calculating frametime standard deviation. This shows you how much your frametime miss your target budget. This is the refresh rate of your monitor. Variable refresh rate technology alters rule a little bit, but doesn’t eliminate it entirely. By syncing the display with the moment of frame generation, VRR hides minor variations, but it can’t mask major spikes. These throw off sync and lead to stutter or even visibly detectable hitching.
This check in the calculator will let you know whether your frames stays inside the range of what your monitor supports. It will flag instances where you are pushing hardware too hard. It also provides a reachable limit just below the VRR max. That means your PC can remain stable while losing very little in terms of actualy performance.
Gathering decent data is also something that takes time, shorter samples don’t provide as complete a picture. This is because you could get away with some pretty rough looking video for ten seconds, since it may of been uneventful footage during that time. When we capture longer sessions, then the real variation come out. You’ll see the lighting change and terrain shift. Combat sequences will stress it different than.
Three-hundred or more frames is a good number here to give those lower percentiles confidence. Once you’ve reached the point where you can’t see any faster anyway, chasing averages doesn’t really matter anymore. From here, anything you do to smooth out those lows will help your aim accuracy much more then squeezing another ten frames a second out of the top end.
In many ways, it’s more like turning up the engine until you reach a certain point, then tweaking it a hair to keep it running smoothly all the time; it doesn’t look any different on paper, but it makes a world of difference in the heat of battle.