⚾ Fantasy Baseball Trade Calculator
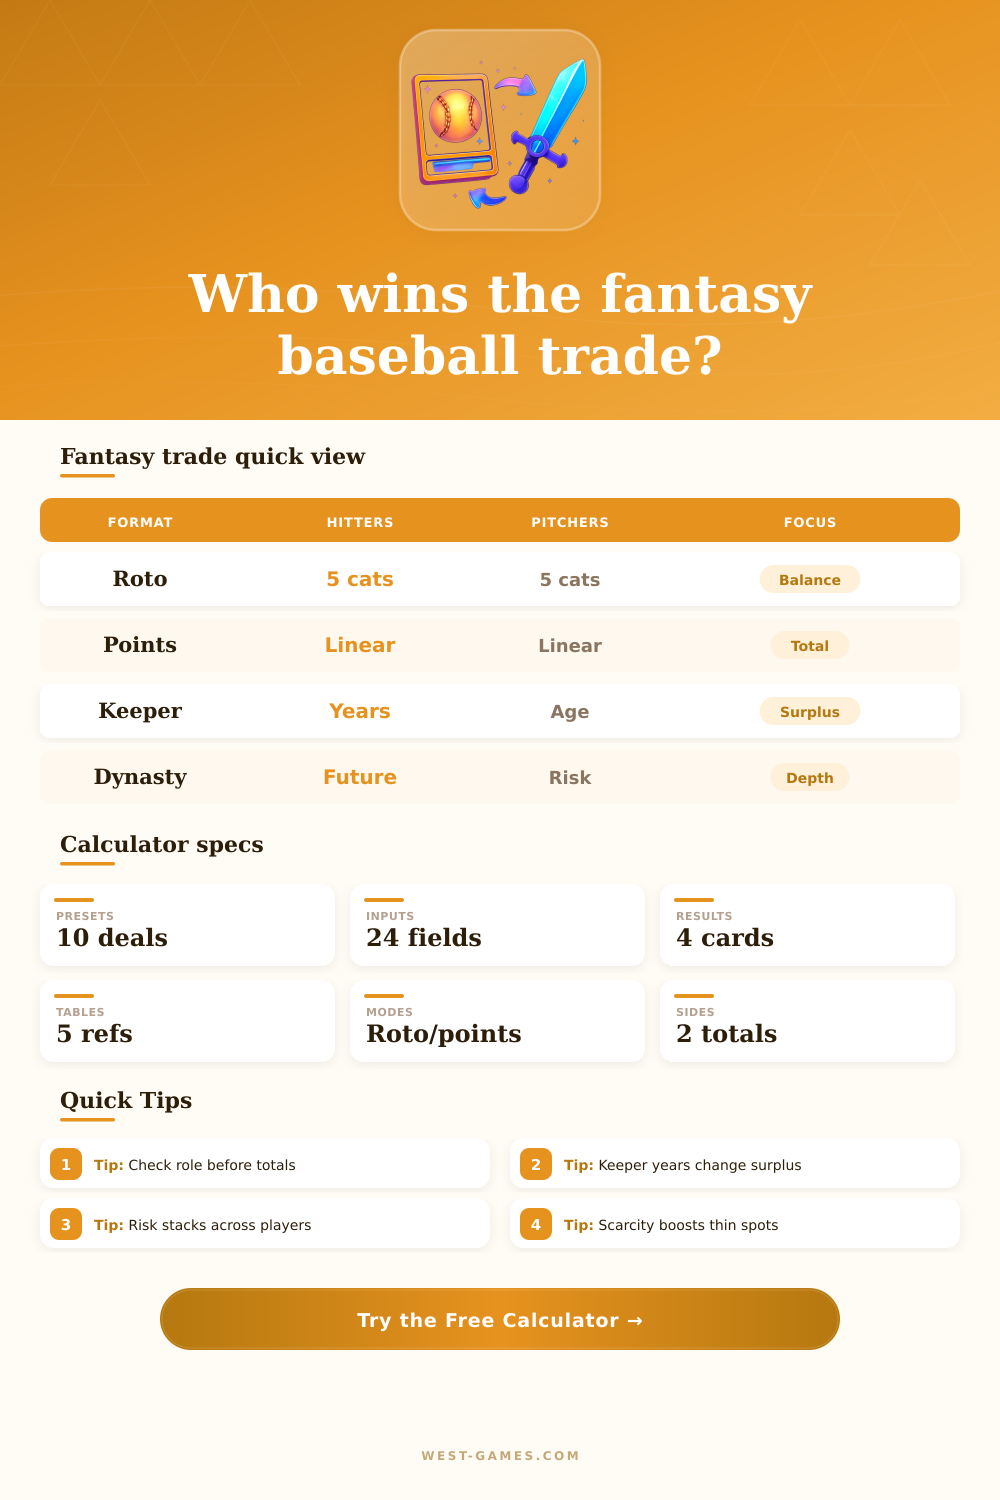
Compare multi-player trade sides with hitter and pitcher value, category weights, roto or points scoring, keeper seasons, injury risk, positional scarcity, and replacement level.
| Tier | Base value | Typical fantasy asset | Trade note |
|---|---|---|---|
| Elite anchor | 90 | Round-one bat or ace | Usually needs a premium return |
| All-star | 74 | Stable top lineup or SP2 | Strong one-for-one piece |
| Solid starter | 58 | Every-week lineup piece | Often balances larger deals |
| Streamer | 39 | Matchup or role play | Close to replacement in shallow leagues |
| Prospect stash | 34 | Future upside player | Keeper window drives the value |
| Slot | Scarcity | Why it changes trades | Best use |
|---|---|---|---|
| Catcher | 1.14x | Thin starter pool | Boost only for playable bats |
| Middle infield | 1.08x | Speed and volume matter | Roto category balance |
| Corner infield | 1.02x | Power is easier to replace | Compare power need first |
| Outfield | 1.00x | Wide player pool | Use raw category fit |
| Closer | 1.12x | Saves role can disappear | Pair with risk setting |
| Starter | 1.04x | Volume plus ratios | Boost when innings matter |
| Need | Raise input | Players helped | Watchout |
|---|---|---|---|
| Home runs and RBI | Power and RBI | Middle-order bats | Batting average drag |
| Steals and runs | Steals and runs | Leadoff speed bats | Playing time risk |
| ERA and WHIP | ERA and WHIP | Ratio arms | Low innings can cap impact |
| Wins, saves, K | Volume stat need | Workhorse SP and RP | Team context volatility |
| Asset | Points strength | Common boost | Risk lever |
|---|---|---|---|
| Durable hitter | Plate appearances | Volume weight | Low injury risk |
| Power hitter | Total bases | Power weight | Strikeout rules |
| Ace starter | Innings and K | Pitcher weight | Workload risk |
| Closer | Saves spikes | Volume weight | Role risk |
| Gap | Grade | Meaning | Manager action |
|---|---|---|---|
| 0 to 5% | Even | Close enough to decide by roster fit | Use category needs as tiebreaker |
| 5 to 12% | Lean | One side gains a small edge | Ask for a minor sweetener |
| 12 to 25% | Strong | Noticeable value gap | Rebalance with a starter or pick |
| 25%+ | Lopsided | Major projection or keeper difference | Rebuild the offer before accepting |
Heart pounding as you eye up the trade offer, you wonder: Is this gonna be the move to save your season, or kill it? Most fantasy baseball trades aren’t simply about stats. They’re psychological games played out through probability theory. Player values changes with each owner’s pen, categories lost, and injury fears.
Plug in your league settings into the calculator, and it does the rest. It removes guesswork from coefficients and conversions most managers gets wrong based off gut feeling rather than structural reality. Managers gets suckered by the idea that all positions are created equal. Sure, that guy’s a big-time outfielder. That looks good on paper. But a great catcher is rarer to find. And rarity equals value. Estimates will not give you an exact read on that. The reality is there’s less catching depth (less talent + less stable role) then left-field depth. Positional scarcity are important. The tool reflects that in its adjustments.
Why You Need a Fantasy Baseball Trade Calculator
That’s why, when you’re cobbling together a roster, it makes a huge difference even if they “match” in batting average. The guy you’re giving up might be the team’s only viable starting catcher, while the guy you’re getting back is someone who’s easily replaceable from waiver wire. That’s a loss of value; but one that goes unnoticed unless you look at reference table. There, the multipliers tell the tale: they show how much talent depth and role stability affect the multiplier.
The other variable that often goes under the radar is risk. It’s one thing to have an elite projection on your hands, but another if he has a long list of shoulder problems. Likewise, a player who has consistently produced for 10 years might be more valuable to you than someone with higher production levels but a poor track record of staying healthy. By giving yourself the ability to plug in percentages of role or injury risk, you essentially discount the likely upside based on the odds that it won’t happen. No need to overspend on a player getting paid for his dream season when it crashes and burns in July. You don’t buy what they did last year; you’re buying what they can safely do for the next three months. That’s where folks go astray. They fall in love with their peak output and ignore injury lists and the subsequent plateaus.
The other wrinkle is that time is money in keeper leagues. Your younger guys who still have multiple keeper years left are more valuable down the road and less so today. If you’re rebuilding, todays wins aren’t as important as tomorrow’s seasons. Competitive window and keeper year helps balance the time gap. Instead of being tempted to sell your young players low just to make a run at the playoffs (which you may not even make), this prevents that mistake. It forces you to choose whether you’re building for the future or winning now. Then, the tool allows you to try and measure that decision rather than hope it plays itself out.
The philosophy of points leagues is far different than that of roto formats. Each inning pitched and each plate appearance contributes directly toward a player’s season-long score, making volume the name of the game in points scoring. Great per-game stats aren’t enough if they’re compiled only when a player isn’t even in the lineup half the time. The calculator accounts for this by prioritizing roster pressure and replacement level. The distinction between a streamer and a starter becomes narrower when your league is larger. This influences the weight given to depth pieces. What works as a trade in a 12 team league differs from what works in a 6 team superflex competition. There’s less wiggle room; everything has to add up precisely.
Finally, fair isn’t necessarily equal… Raw numbers aren’t always equivalent to a fair trade. It’s about lining up the puzzle pieces so that you minimize your risk while making the most of your weaknesses. You run the tool, you discover where the scales tip, and now you would of had the data to negotiate from a place of strength instead of desperation. This isn’t just about taking what you’re offered; it’s about structuring the deal that puts you in the best possible position to win. Whether that’s pouncing on a closer for saves or loading up on speed for steals, keep your eye on the long game. Trust the adjusted values above the headline stats. Know full well that scarcity will always win out at the end of the day.