💻 ZTT Bottleneck Calculator
Identify CPU & GPU bottlenecks in your PC build with performance ratio analysis
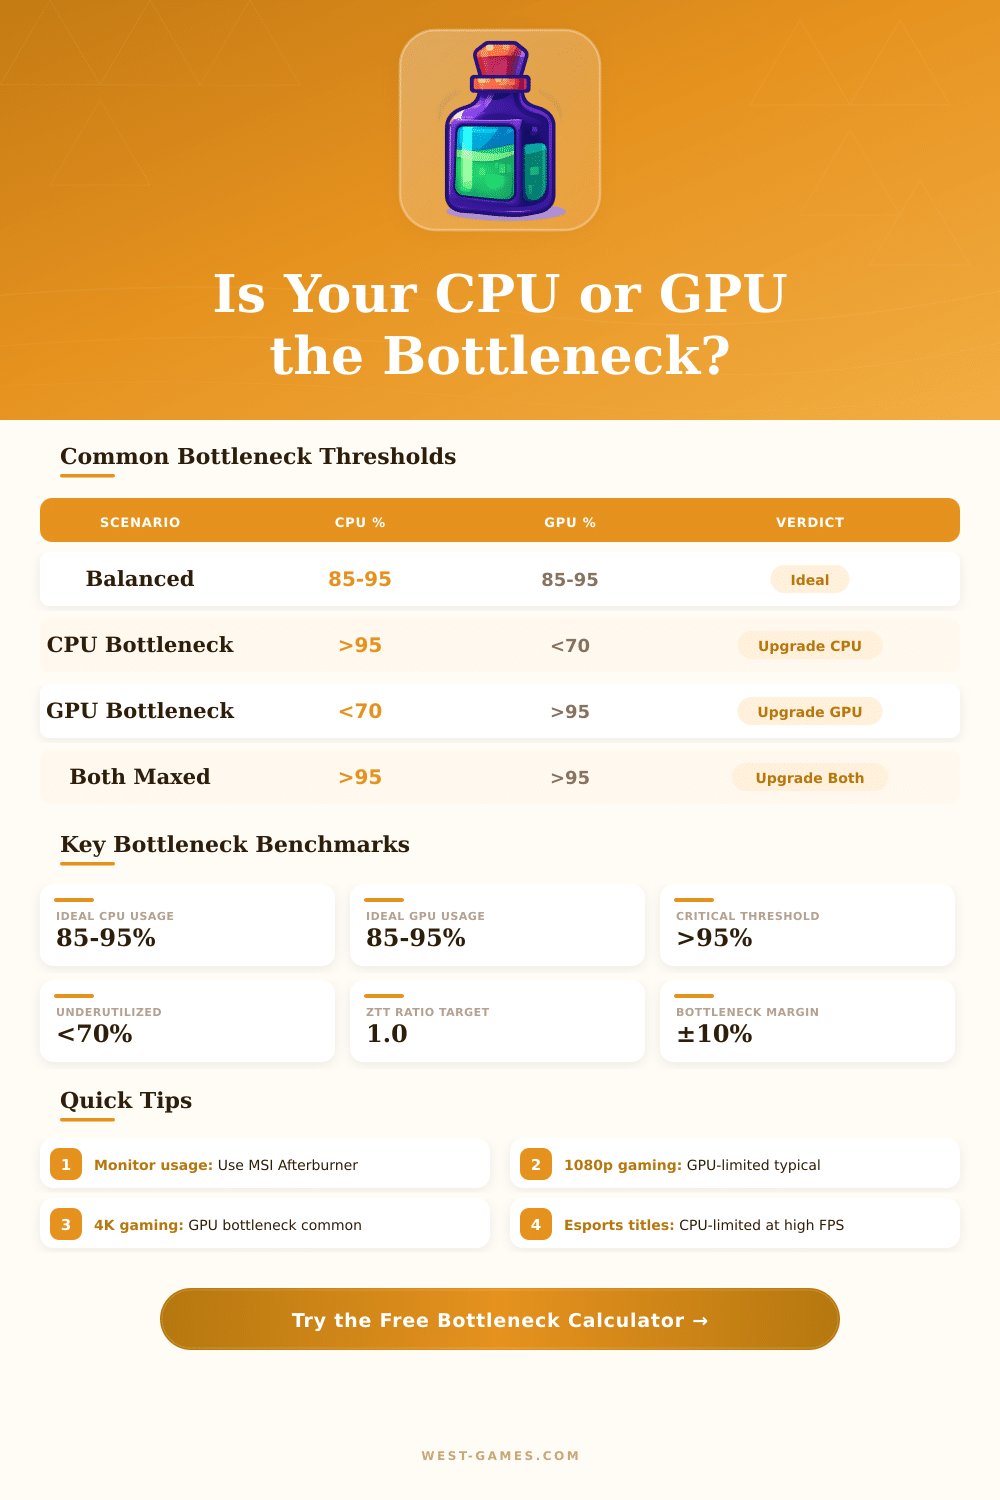
| Resolution | Use Case | Bottleneck Type | Primary Factor | Verdict |
|---|---|---|---|---|
| 1080p | Esports (CS2, Valorant) | CPU-Limited | Single-core IPC | CPU Priority |
| 1080p | AAA (Cyberpunk, Starfield) | GPU-Limited | Raster + RT | GPU Priority |
| 1440p | AAA Gaming | GPU-Limited | VRAM + Raster | GPU Priority |
| 1440p | Esports High FPS | CPU-Limited | Core count + Clock | CPU Priority |
| 4K | AAA Gaming | GPU-Limited | VRAM + Bandwidth | GPU Priority |
| 4K | Streaming + Gaming | CPU-Limited | Encode threads | CPU Priority |
| 1080p | Workstation / CAD | CPU-Limited | Multi-core score | CPU Priority |
| Any | Balanced Gaming Build | None / Balanced | ZTT Ratio ~1.0 | Balanced |
| CPU | Cores | Base Clock | PassMark Score | Tier |
|---|---|---|---|---|
| Intel Core i9-14900K | 24 | 3.2 GHz | ~62,000 | Flagship |
| AMD Ryzen 9 7950X | 16 | 4.5 GHz | ~59,000 | Flagship |
| Intel Core i7-14700K | 20 | 3.4 GHz | ~51,000 | High-End |
| AMD Ryzen 7 7700X | 8 | 4.7 GHz | ~38,000 | High-End |
| Intel Core i5-13600K | 14 | 3.5 GHz | ~36,000 | Mid-Range |
| AMD Ryzen 5 7600X | 6 | 4.7 GHz | ~27,000 | Mid-Range |
| Intel Core i5-12400F | 6 | 2.5 GHz | ~20,000 | Entry |
| Intel Core i3-12100F | 4 | 3.3 GHz | ~14,000 | Budget |
| Intel Core i7-8700K | 6 | 3.7 GHz | ~14,500 | Aging |
| GPU | VRAM | TDP | PassMark Score | Tier |
|---|---|---|---|---|
| NVIDIA RTX 4090 | 24 GB | 450W | ~36,000 | Flagship |
| NVIDIA RTX 4080 Super | 16 GB | 320W | ~30,000 | High-End |
| AMD RX 7900 XTX | 24 GB | 355W | ~29,500 | High-End |
| NVIDIA RTX 4070 Ti | 12 GB | 285W | ~26,000 | High-End |
| NVIDIA RTX 4070 | 12 GB | 200W | ~22,000 | Mid-High |
| AMD RX 7700 XT | 12 GB | 245W | ~19,000 | Mid-Range |
| NVIDIA RTX 4060 | 8 GB | 115W | ~17,000 | Mid-Range |
| AMD RX 6600 | 8 GB | 132W | ~12,000 | Budget |
| NVIDIA GTX 1660 Super | 6 GB | 125W | ~10,500 | Aging |
A bottleneck calculator is a tool for checking how well the parts of a computer work together. The idea is quite simple: you enter the specs of the system, like CPU, GPU and RAM, and the program tries to count whether one part slows another. Some of those calculators compare performance scores using benchmark databases and give a rating about how that affects the FPS at chosen resolution.
They also can show if the system is more CPU-bound or GPU-bound which helps to decide what part maybe needs an upgrade first.
What bottleneck calculators do and don’t do
Some bottleneck calculators carry a big library of games for FPS calculations. The user can check system demands, compare settings and see if the computer can run a particular game. Some tools even look at output through more than 80 games, considering things like recording, streaming and video editing settings besides gaming.
However bottleneck calculators have an important problem about accuracy. The bottleneck depends on the actual software used, on the tasks done, and on the graphical settings during play. Different games use the CPU and GPU very differently.
For instance, one game can be very CPU-heavy, while another relies much more on the GPU. Because of that the bottleneck percentages would be totally different in every case, because the CPU and GPU not always are fully used at the same tyme.
For truly counting bottleneck, the tool should know what game one plays, in what resolution, and what precise graphical settings are chosen. It also would require actual performance data for all those hardware and software combinations. But most of those tools simply do not have such data.
Because of that a bottleneck calculator usually can give only a rough idea about how well the CPU and GPU match. The results are based on average usage of various programs and games, and they change according to the operating system, background processes and the particular apps intended. There is not won alone perfect website for comparing items or bottlenecks.
More wise is to look at several sources and come to your own conclusion.
Despite that, those tools sometimes can point out real mismatches. When one raises the resolution, that creates more work for the GPU, but not a lot of extra work for the CPU, so at higher resolutions the GPU ends up being less free. Such a general guide can be useful, even if the precise percentages are not fully reliable.
And because they sometimes offer personal tips about hardware upgrades, bottleneckcalculators at least can serve as a rough starting spot.